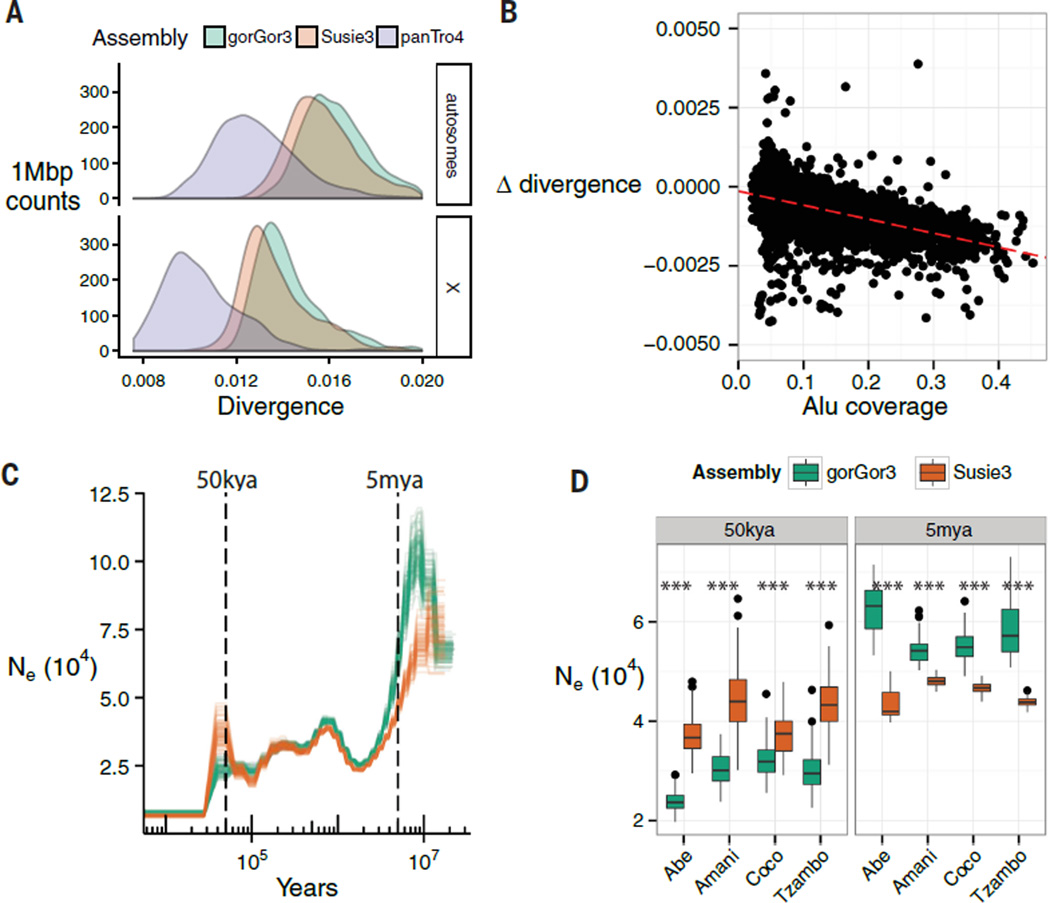
Fig. 6. Population genetic analyses.
(A) Density of average divergence within 1-Mbp windows between human (GRCh38) and gorGor3, Susie3, or chimpanzee (panTro4) autosomes. (B) A comparison of human-gorGor3 and human-Susie3 divergence over 1-Mbp windows. The x axis is Alu coverage in each window, and the y axis is the difference in human-gorilla divergence between gorGor3 and Susie3. Positive y axis values indicate increased human–Susie3 divergence relative to human–gorGor3. The increased divergence of human–gorGor3 correlates with Alu content (slope, −0.0044094; intercept, 0.0001486; Pearson’s correlation, −0.60). (C) The effective population size (Ne) shown over time. A PSMC model was applied to the western lowland gorilla based on different genome assemblies. Illumina genome sequence data from western lowland gorillas (Abe, Amani, Coco, Tzambo) was mapped against gorGor3 (green) and Susie3 (orange), and PSMC was fit to the genome alignments (-N25 -t15 -r5 -b -p “4+25*2+4+6”; mutation rate = 1.25 × 10⁻⁸; generation time = 19 years). There are 100 bootstrap replicates for each gorilla and model. (D) The distribution of the bootstrap intervals that overlap 50 ka and 5 ma. At 50 ka, Susie3 estimates of the effective population size are significantly higher than that for gorGor3; the inverse pattern is true for 5 ma. All differences between Susie3 and gorGor3 are significant (***P ≤ 0.0001; Welch two-sample t test).

