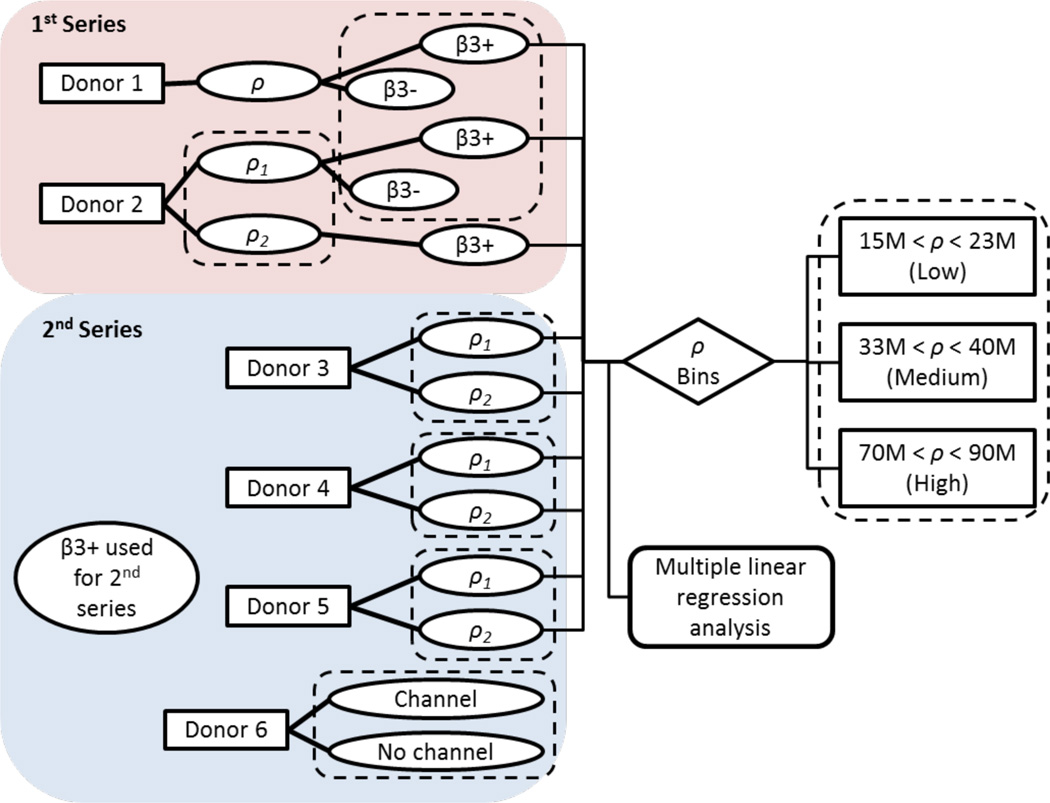
Figure 1.
Experimental design for human constructs. ρ = cell seeding density, β3+ = continuous TGF-β treatment, β3- = transient TGF-β treatment. Dotted rectangles indicate between which groups statistical comparisons were made. Culture durations were examined in all statistical analyses but for simplicity are not depicted.

