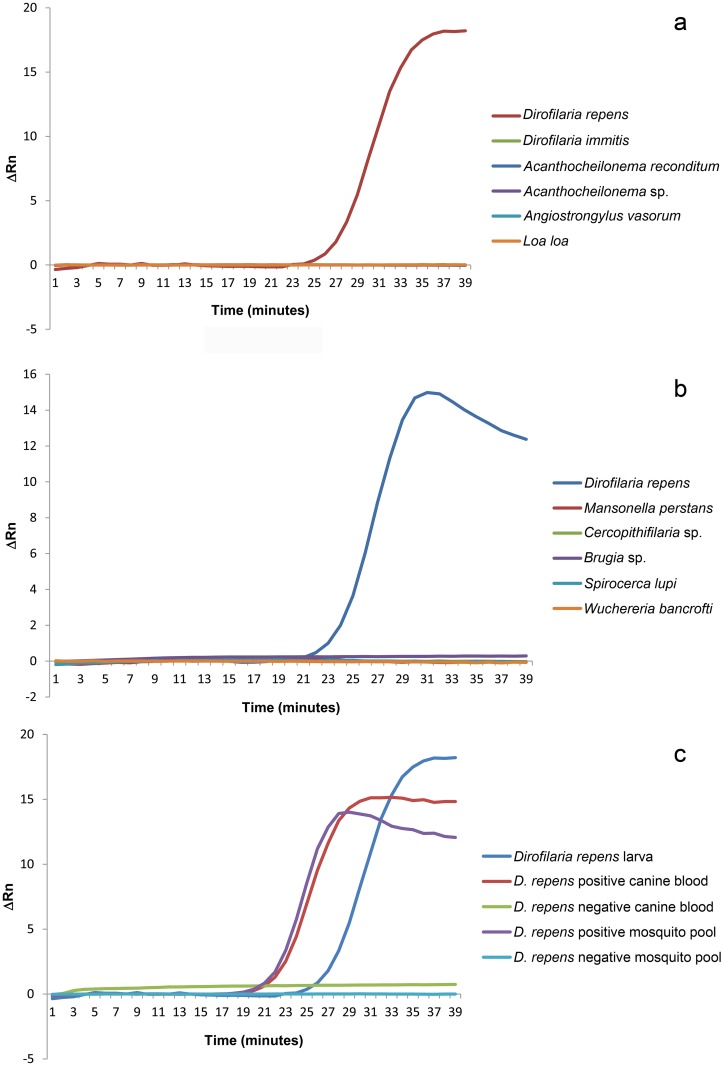
Fig 2. Specificity of the ReT-LAMP.
The curves represent the amplification signals expressed as ΔRn, after subtraction of the ROX reference dye fluorescence. a) and b) Amplification curves from ReT-LAMP carried out with DNA from larvae of previously identified species. The curves from species different from D. repens are overlapped because of the lack of an appreciable signal. c) Amplification curves from DNA extracted from biological samples (mosquitoes and canine blood).

