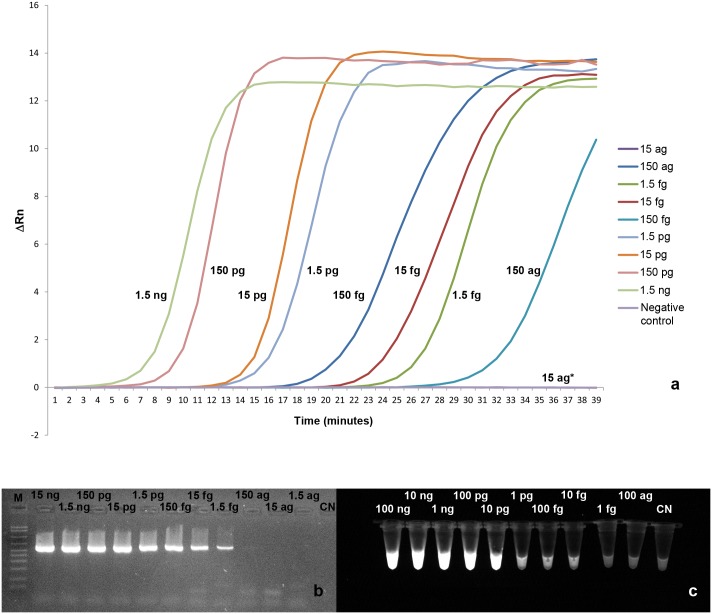
Fig 4. Results of the sensitivity assay.
a) ReT-LAMP. The curves represent the ΔRn after subtraction of the ROX reference dye fluorescence. The amount of D. repens DNA for each reaction is indicated near the respective curve. *The curves of the reaction with 15 ag of DNA and of negative control are overlapping. b) PCR. M: AmpliSize Molecular Ruler, 50–2,000 bp Ladder (BioRad Laboratories, Milan, Italy). c) PI-LAMP. The bright fluorescence indicates the positivity of the reaction.

