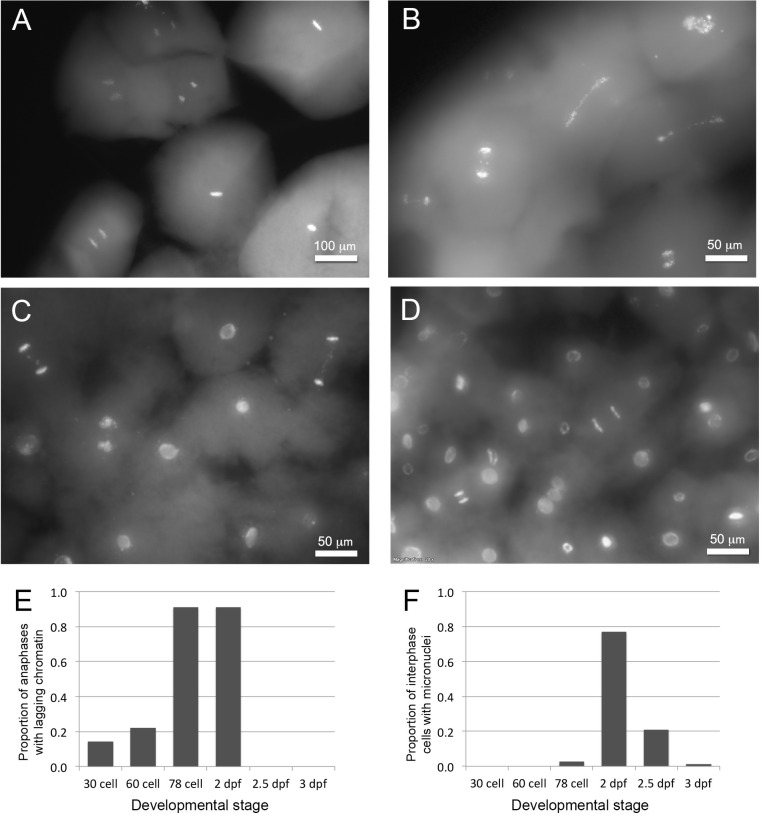
Fig 3. Timing of chromatin elimination.
(A-D) PACT-cleared embryos, stained to highlight DNA (SYTO-24). (A) Cells from a 30-cell embryo at 1 dpf. Interphase cells lack micronuclei, and no lagging chromosomes are visible. (B) Cells from a 78-cell embryo at 1 dpf showing numerous anaphases with lagging chromatin. (C) Cells from an embryo showing anaphases with lagging chromatin and interphase cells with micronuclei. (D) Cells from an embryo at 2.5 dpf with few visible micronuclei and anaphases without lagging chromatin (presumably reflecting the completion of programmed genome rearrangement during earlier cell divisions). (E) Observed proportions of anaphases with lagging chromatin across early developmental stages. (F) Observed proportions of interphase cells containing micronuclei across early developmental stages.

