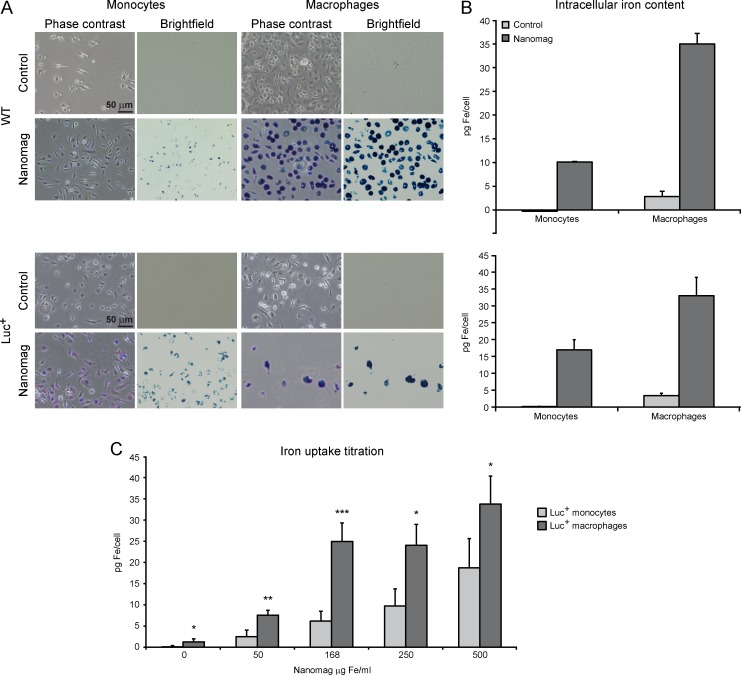
Fig 1. In vitro iron labelling efficiency of monocytes and MΦ (WT and luc+).
(A) Overnight incubation with 168 μg Fe/ml resulted in blue deposits in phase contrast and brightfield microscopy images of PB staining in monocytes and MΦ (scale = 50 μm). (B) Photometric iron content analysis for control (light grey) and contrast agent labelled WT and luc+ cells (dark grey; 168 μg Fe/ml), with 2–6 experiments per cell type and Nanomag concentration. (C) Photometric iron uptake titration of luc+ monocytes and MΦ. Mean photometric values are displayed as pg Fe/cell. Statistical significance (ANOVA/Kruskal-Wallis: * p ≤ 0.05, ** p ≤ 0.005, *** p ≤ 0.001)always indicates the difference in iron uptake between luc+ monocytes and luc+ macrophages. Luc+ monocytes: 4–11 experiments per concentration, luc+ Mɸ: 5–7 experiments per concentration.

