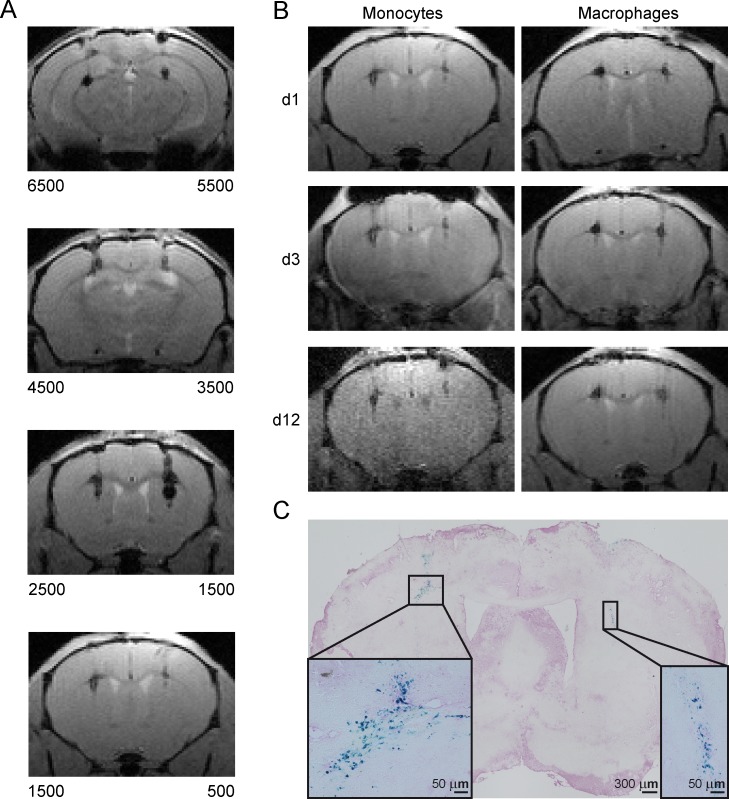
Fig 5. In vivo longitudinal detectability of grafted monocytes and MΦ using MRI at 9.4 T.
(A) Qualitative MR images (MGE sequence) of graft titration with different numbers of SPIO labelled monocytes (WT), with the cell numbers indicated below both hemispheres, n = 1. Transplanted cells are visible as small hypointense clusters. (B) Imaging time course of transplanted WT monocytes and MΦ for days 1, 3 and 12 post transplantation. Left hemisphere 1500, right hemisphere 500 cells, n = 1 per cell type. (C) Representative PB staining of brain tissue section indicating grafted monocytes as PB+ (blue) cells. Scale = 50 μm.

