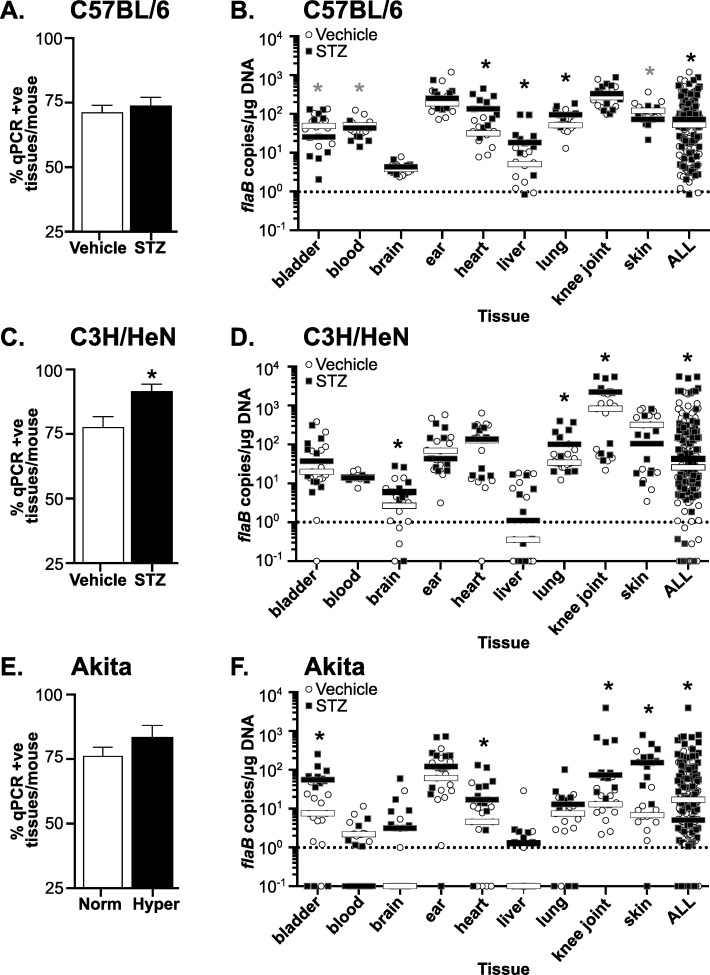
Fig 2. B. burgdorferi tissue colonization and bacterial DNA copy number in hyperglycemic and normoglycemic mice.
(A, C and E) Percentage of tissues/mouse positive for B. burgdorferi flaB DNA in infected normoglycemic and hyperglycemic mice at 4 weeks post-infection. Percentage of qPCR-positive tissues/mouse in C57BL/6 (A), C3H/HeN (C), and Akita (E) mice are shown. (B, D and F) Median B. burgdorferi flaB copy number/μg total DNA in indicated tissues and in all tissues combined (ALL) in infected normoglycemic and hyperglycemic mice at 4 weeks post-infection. Shown are individual values and medians (bars) in tissues of C57BL/6 (B), C3H/HeN (D) and Akita (F) mice. Values are plotted on a log scale to facilitate visualization of a large range of values. Dotted lines in each graph indicate the cutoff point (1 flaB copy/μg DNA) below which tissues were considered negative. Statistical analysis: Kruskal-Wallis ANOVA with Dunn’s post-test. For all panels, N = 10–13 mice per experimental group and strain. Fold differences in medians are summarized in Table 2. * indicates p<0.05 vs. normoglycemic controls.

