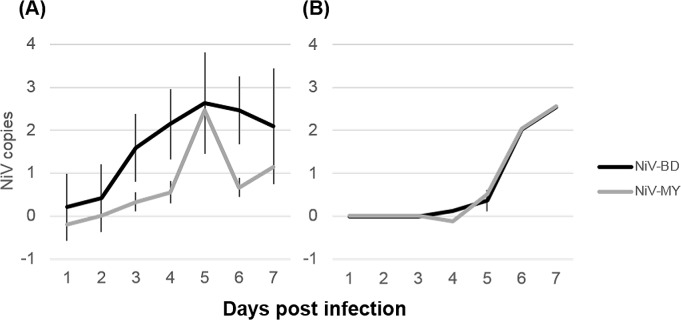
Fig 5. Viral loads in clinical samples from NiV-infected ferrets.
Predicted mean viral RNA levels (NiV N gene copies) over time in respiratory secretions (A) by linear mixed model analysis and blood (B) by univariate ANOVA. Significantly higher levels of viral RNA were recovered from respiratory secretions of NiV-BD-infected ferrets. Levels in blood increased significantly over time but remained comparable between the infection groups (effect of virus Fdegrees freedom = 0.0011, P = 0.97; effect of day F = 9.66, P<0.001). Nipah virus N gene copies are presented as log10 copies per mL sample. Results are presented relative to the original scale. Error bars ±2 SEM.

