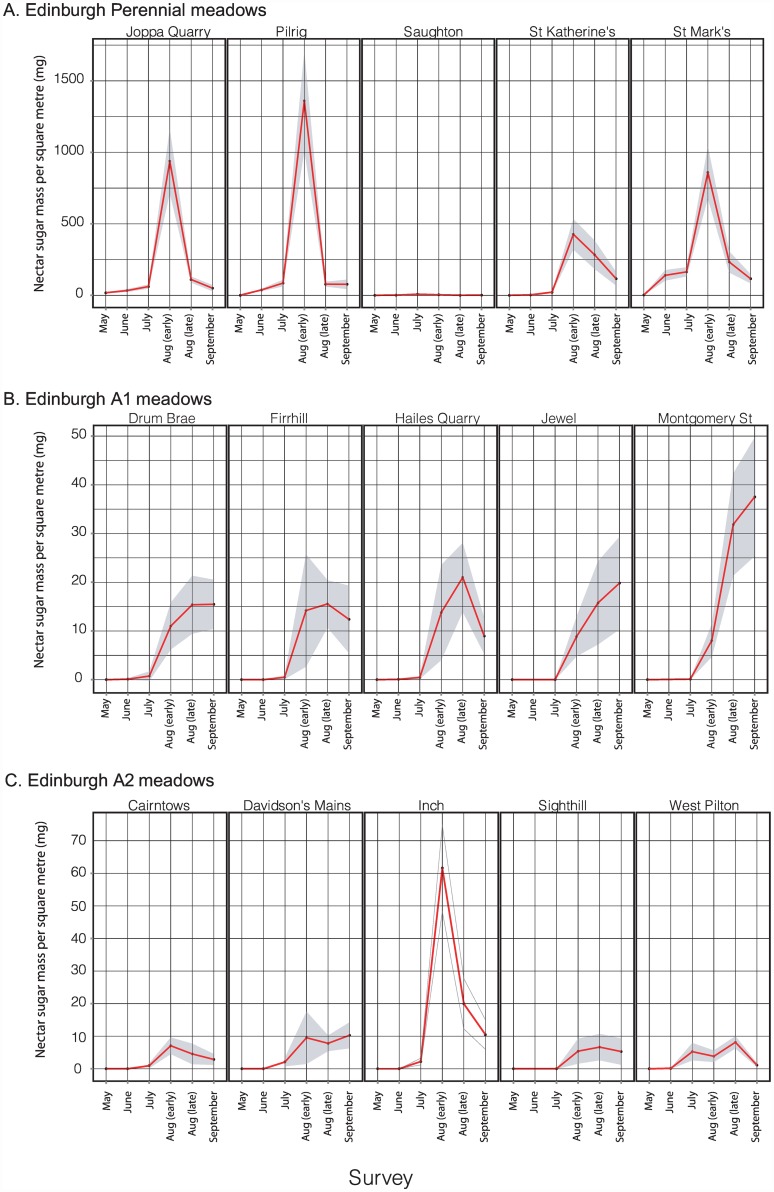
Fig 4. Seasonal patterns in daily nectar sugar availability for individual Edinburgh meadows sown with A. perennial, B. annual A1, and C. annual A2 treatments.
Data were sampled at three-week intervals through 2013. Values at each time point are means based on 20x 1m2 quadrats, with dark shading showing 95% confidence limits. The poor performance of the Saughton perennial meadow was due to accidental mowing, and this replicate was excluded from statistical analyses.

