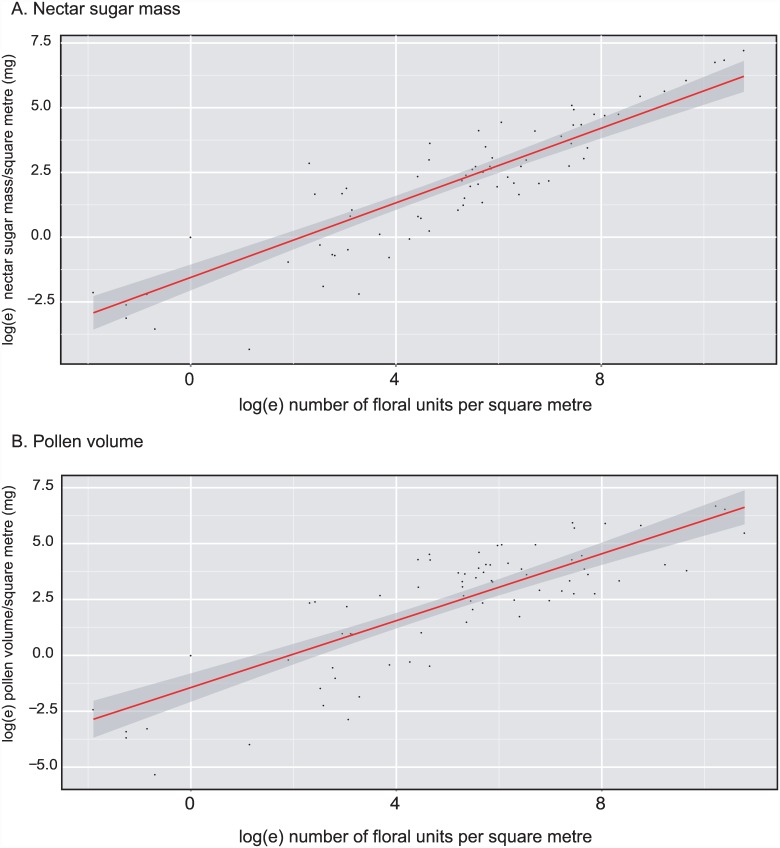
Fig 10. Relationships between counts of floral units and A. nectar sugar mass/m2, and B. pollen volume/m2 across all Edinburgh meadow surveys.
Note that data have been loge transformed. The fitted lines are least squares regressions of the transformed data, with the darker shaded area showing standard errors of fitted values. The fitted lines (± standard errors of estimates, n = 80 in each case) for A is y = 0.721(±0.045)x– 1.556(±0.251), and for (b) is y = 0.748(±0.057)x– 1.439(±0.320).

