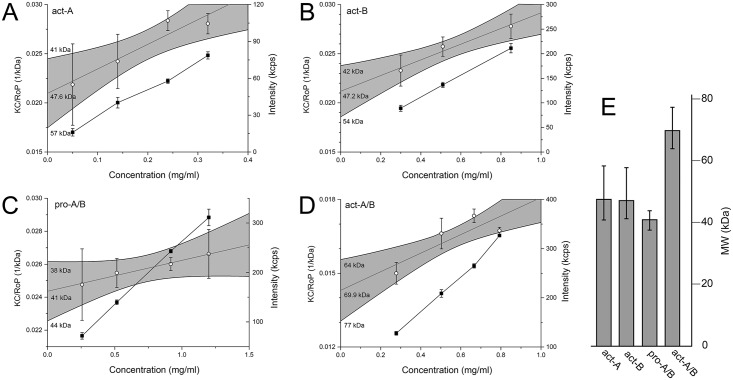
Fig 3. SLS molecular weight determination of BinA and BinB in aqueous solution.
Debye plots of scattered intensity (■) and KC/RoP (○) plotted against protein concentration. (A) act-A; (B) act-B; (C) 1:1 mixture of pro-A and pro-B; (D) 1:1 mixture of act-A and act-B; (E) Calculated weight-average molecular weight, where bars represent 95% confidence interval as shown in panels A-D (greyed area, with limit values indicated.). The molecular weight was obtained from the inverse of the Y-intercept of the linear fit of KC/RoP. Experiments were done in triplicate (each data point represents the mean ± SD).

