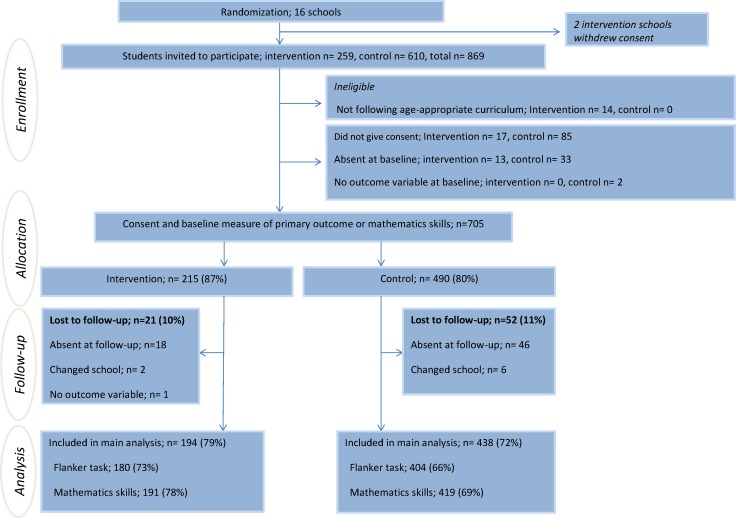
Fig 1. Participant flowchart.
Numbers in percentage are of eligible students except for percentage lost to follow-up, which is of consenting students with a baseline measure of the primary outcome or mathematics skills. Consenting students differ from numbers published previously [18] as student’s not following age appropriate curriculum (n = 14) were not included in the trial. The flow of schools is presented in [18].

