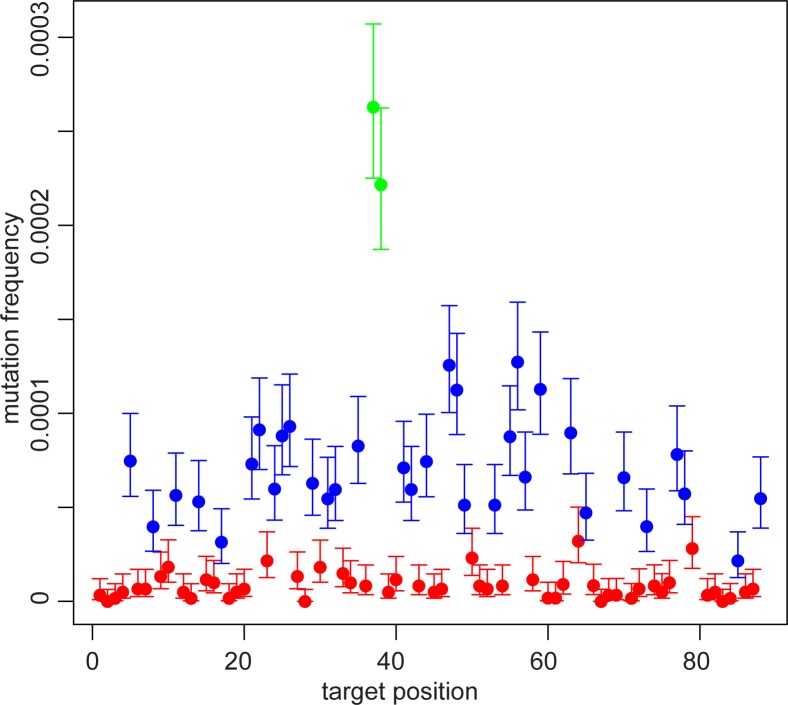
Fig 3. PTPN11 mutation frequencies color-coded by reference base.
Each dot represents the average of 9 different libraries from three testis pieces. Red indicates an A or T base, blue indicates a C or G (non-CpG) base, and green indicates a CpG. The mutation frequency is the sum of all mutations at that site, so, e.g., if a site is a C, the mutation frequency is the sum of the C>A, C>G, and C>T frequencies at that site. The 95% confidence interval for each position is also shown. The data on one base pair (at position 80; c.922) has not been included since it has a much greater mutation frequency; for an explanation, see below.

