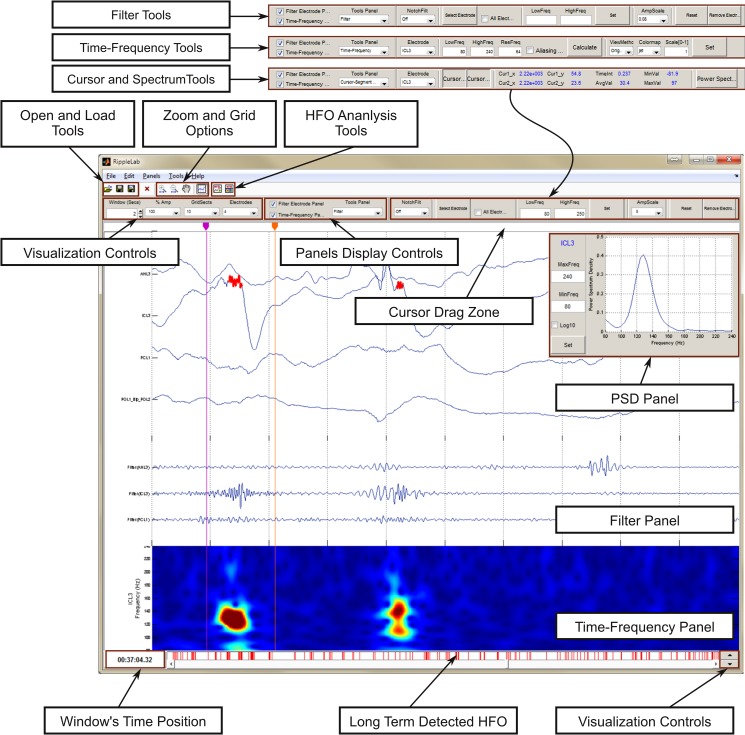
Fig 7. Features in RIPPLELAB main GUI.
An intuitive environment for navigation has been developed, where the user can easily manipulate different options for the display of electrodes. Several options for signal analysis are supplied. These options give users the possibility to make better decisions on the selection of detection parameters. Filter and Time-Frequency panels can be shown or hidden as needed through the display control panel (Panels Display Controls box). Post visualization allows an easy navigation between detected events by presenting red vertical lines at each detected position.

