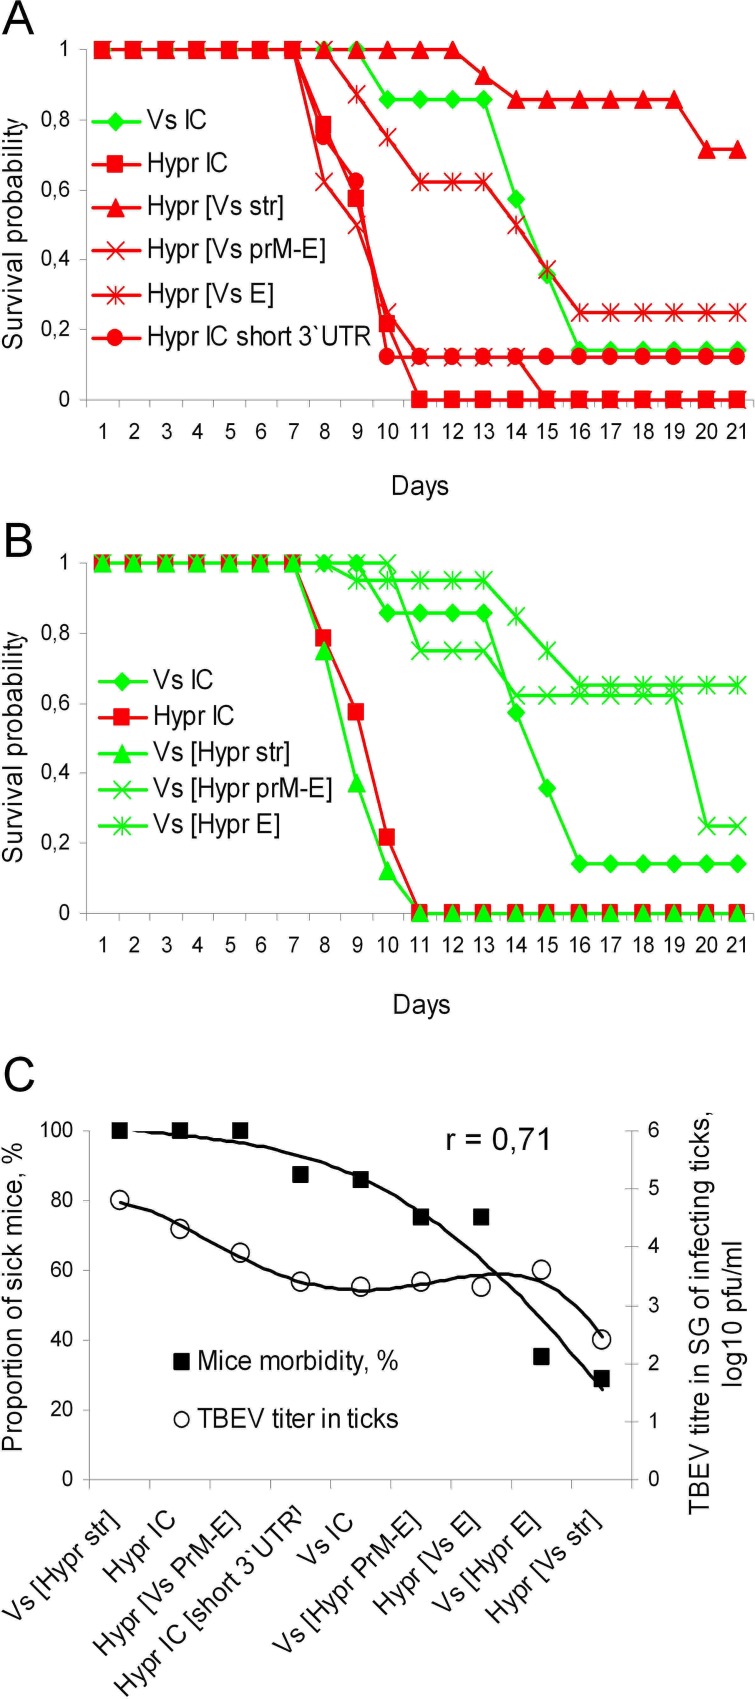
Fig 7. TBEV replication in mice following transmission from ticks.
Mice infected via tick bites during the NVT experiments were observed for 21 days and cumulative numbers of challenged and moribund mice were analysed. A) Survival dynamics of mice infected with Vs-based (green lines/bars) chimaeras; B) Survival dynamics of mice infected with Hypr-based (red lines/bars) chimaeras. The probabilities of survival were estimated using Kaplan-Meier method; C) Correlation between mouse morbidity and infectious dose of TBEV in adult tick salivary glands following the termination of co-feeding. The data are arranged in descending order of mouse morbidity. The trend lines were drawn using the order 4 polynomial method (R2 ≥ 0.95). The (r) value in the top right corner of the chart reflects the Pearson’s coefficient of correlation between datasets.

