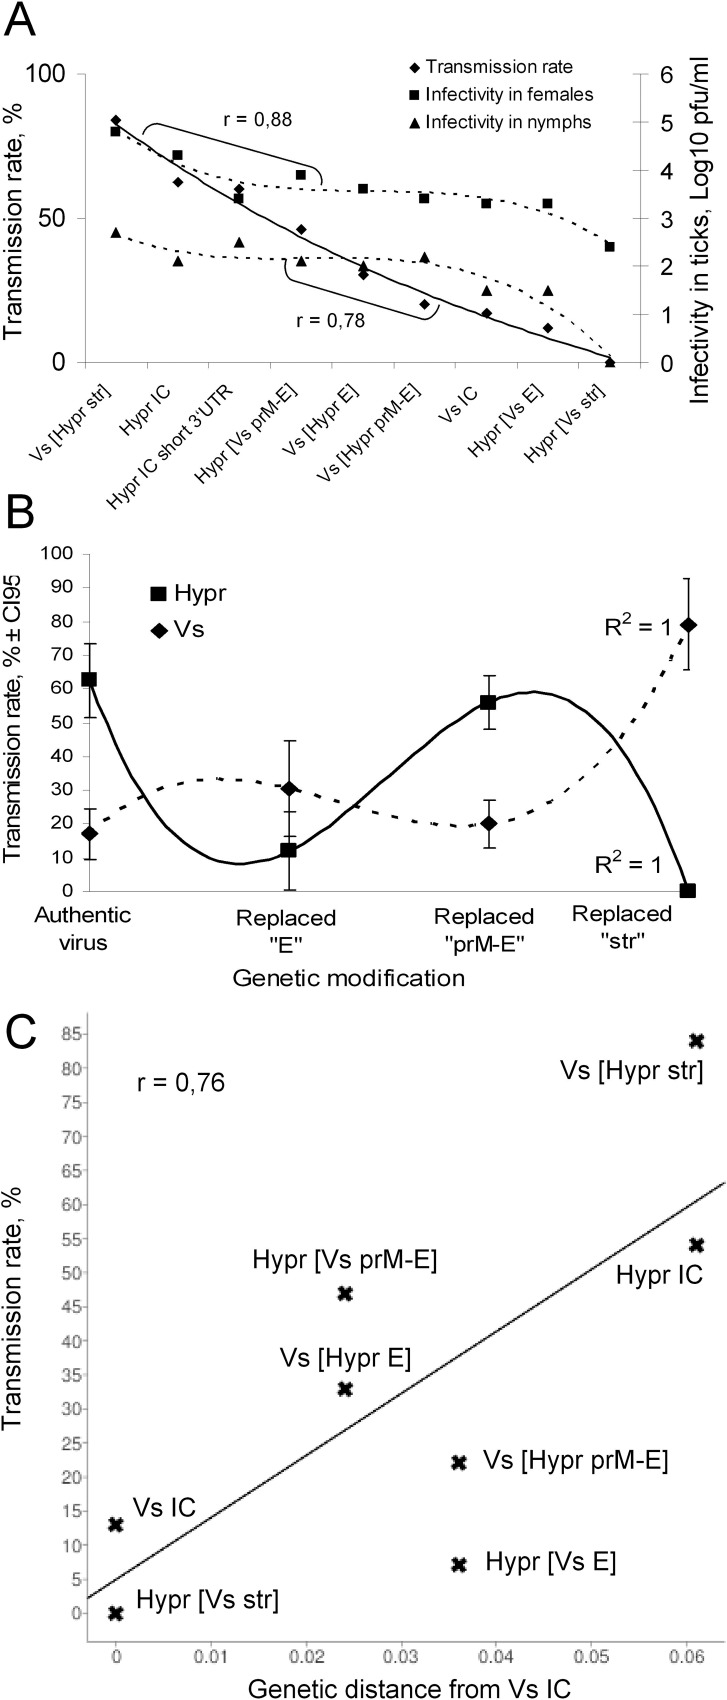
Fig 8. Impact of genetic background on NVT of TBEV.
A) Correlation of non-viratemic transmission (NVT) rates of different TBEV chimaeras with reproduction rate in different life stages of ticks. The trend lines are estimated by the polynomial method. The Pearson`s correlation coefficients between NVT rate (solid trend line) and titres in ticks (dashed lines) are shown by brackets with indicated r values. B) Correlation of TBEV gene replacements with NVT rate. The solid and dashed trend-lines reflect the changes in Hypr and Vs NVT rate efficiency respectively, in correspondence with size of exchanged gene fragments. Trend-lines were drawn using order 3 polynomial method with R-square value shown at the right end of the corresponding trend line. C) Correlation between NVT rate and the amino acid substitutions. The amino acid differences between C-prM-E region of polyprotein of control and chimaeric viruses are plotted on the X-axis as number of amino acid substitutions per site in comparison to VsIC sequence. The NVT rates are plotted on the Y-axis. The linear regression is calculated using equation [Y = 914.53*X + 4.77] and shown as solid line (goodness of fit R2 = 0.58). The Pearson’s correlation coefficient (r) is shown in top left corner of the panel.

