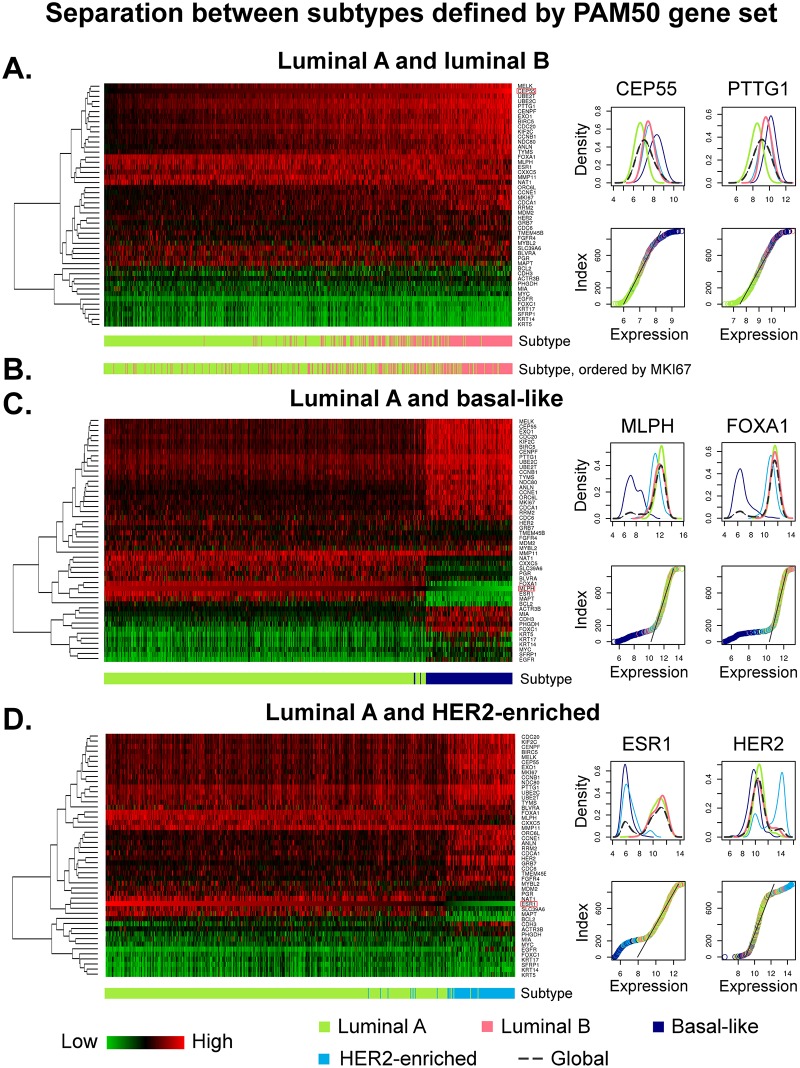
Fig 1. Separation features between luminal A and luminal B, basal-like, and HER2-enriched subtypes defined by PAM50 assay.
The heat maps are generated from Illumina probe profiles, normalised using mean expression levels of control samples (black), where an over-expression relative to controls is shown in red, and an under-expression in green. Samples in each heat map are ordered by expression levels of the probe mostly differentiating between the corresponding pair of subtypes. (a) Luminal A (n = 451) and B (n = 229) samples are ordered by CEP55. There is no clear boundary between these subtypes evident, and the global distribution functions of the top two genes mostly differentiating between these subtypes, are unimodal. (b) Luminal subtypes ordered by expression levels of MKI67. (c) Luminal A (n = 451) and basal-like (n = 125) samples are ordered by absolute expression values of MLPH. These subtypes exhibit varying expression levels relative to controls (under- and over-expression), and the global density distribution functions of the top two genes are multi-modal with two peaks—one corresponding to luminal A and the other one exclusively to basal-like. (d) Luminal A (n = 451) and HER2-enriched (n = 91) samples are ordered by ESR1. These subtypes also show varying expression levels relative to controls, and the global density distribution functions of the top two probes are multi-modal.

