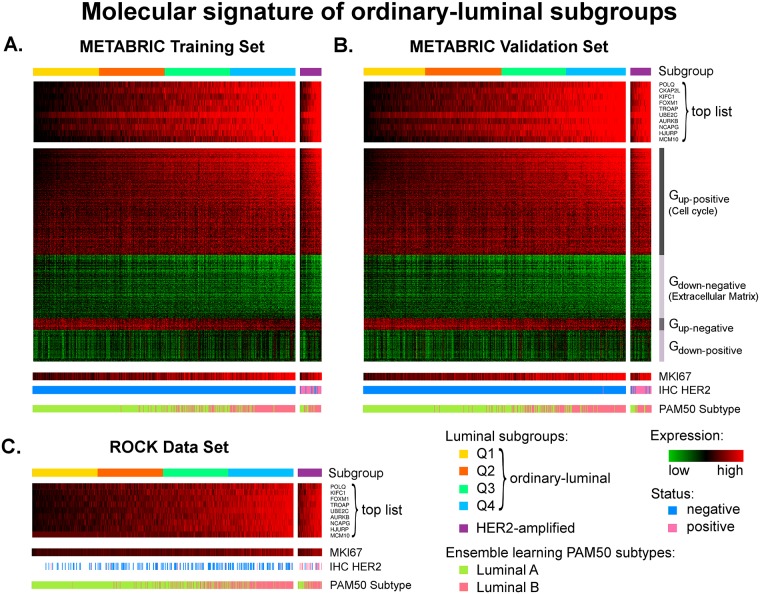
Fig 5. Molecular signature of ordinary-luminal subgroups.
Heat maps in this figure show relative expression of the top ten list of genes used to define four quantiles within ordinary-luminal tumours: Q1 (yellow), Q2 (orange), Q3 (spring-green) and Q4 (blue), in the METABRIC training (a), validation (b) and ROCK (c) data sets (n = 629, 629 and 975, respectively). The 600 probes identified to be related to survival outcomes, split into groups Gup-positive, Gdown-negative, Gup-negative and Gdown-positive, show co-expression among each other, and with the top ten list. In the METABRIC data set, the red colour corresponds to an over-expression relative to controls, green—to an under-expression, and the black colour stands for the mean expression levels of controls. In the ROCK data set, the scale black-red was used, as the controls are not available. The expression levels of same probes for the HER2-amplified luminal (n = 51, 51 and 90, respectively, shown in purple) groups are also shown in this figure, including the corresponding IHC HER2-status (negative in blue and positive in pink). MKI67 expression levels and luminal A and B subtype distributions, defined using the PAM50 ensemble learning method [32], are depicted in separate bars.

