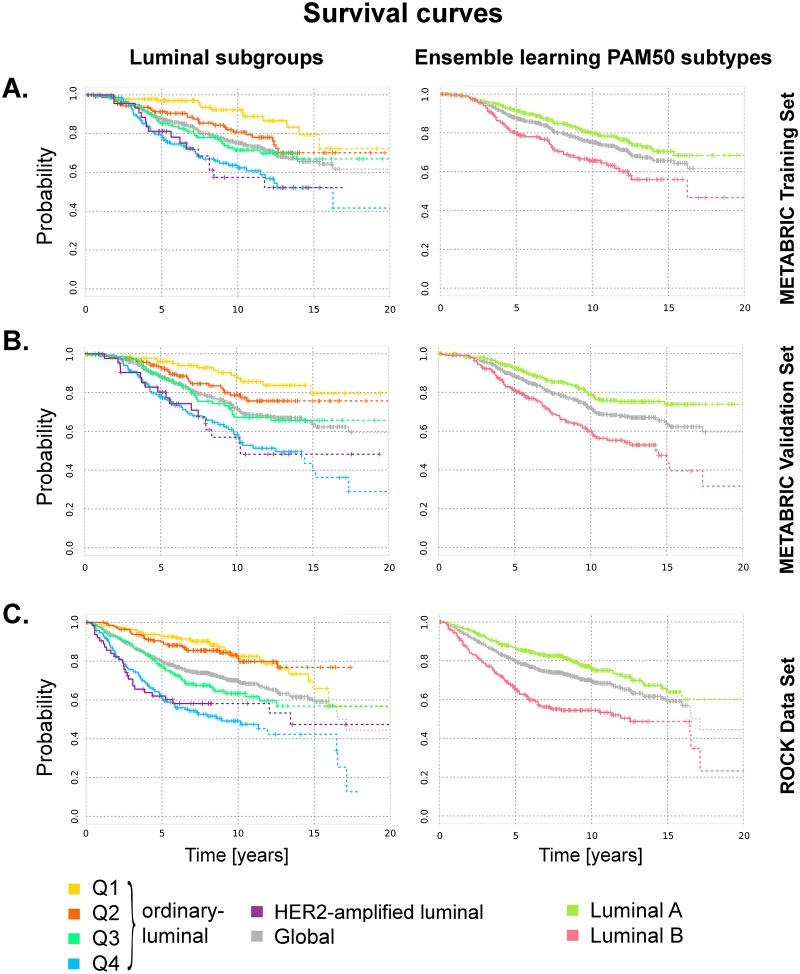
Fig 6. Survival curves for luminal subgroups.
Survival probabilities of ordinary-luminal Q1 (yellow), Q2 (orange), Q3 (green) and Q4 (blue), and HER2-amplified luminal (purple) subgroups in the METABRIC (a) training, (b) validation and (c) ROCK data sets are plotted using the Kaplan-Meier estimator (n = 635, 625 and 827, respectively). The overall survival rates in each data set are shown in grey. Ticks represent sensors, corresponding to patients alive at a given point of time, and the drops represent deaths. The last 20 observations are denoted with a dash line. Kaplan-Meier curves of the same luminal tumours, but stratified by ensemble learning PAM50 subtypes [32], are plotted in the second column for comparison purposes. In the METABRIC data set, the disease-specific survival was considered, while in the ROCK data set the relapse-free survival was employed.

