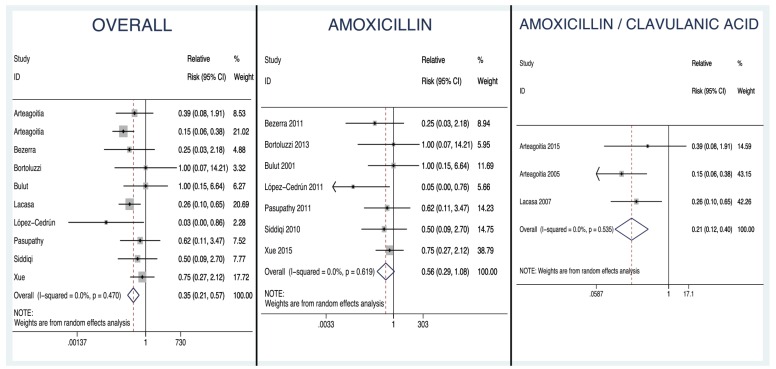
Figure 2.
Forest Plots. Overall forest plot: graphical representation of the estimates of the RRs and 95% CIs based on the samples in each of the studies, including both those that used amoxicillin and those that used amoxicillin/clavulanic acid, together with their relative weights. Amoxicillin forest plot. Amoxicillin/clavulanic acid forest plot.

