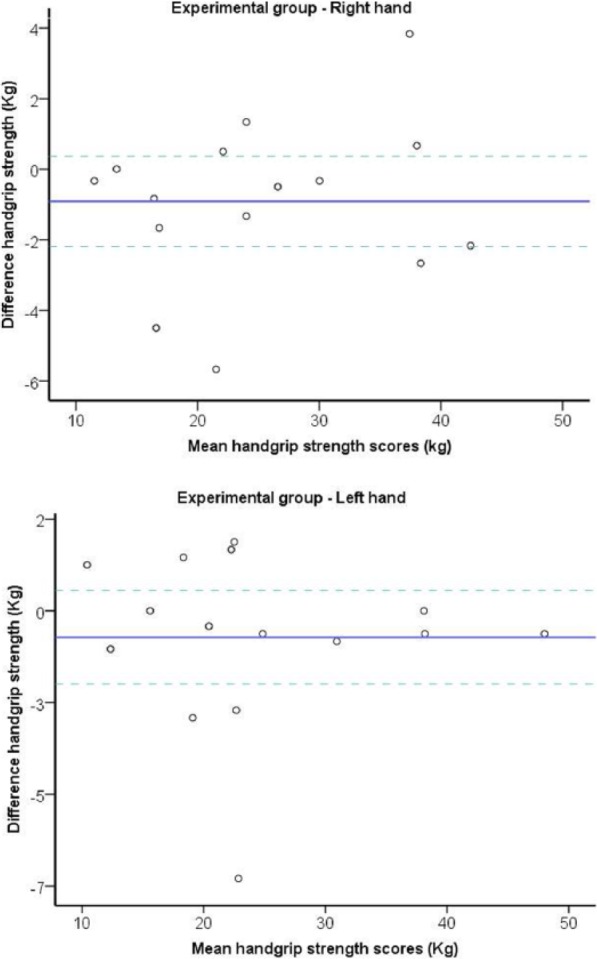
Figure 1.

Bland-Altman plots of the handgrip strength test for experimental group in subjects with PD.
Note. The central line characterizes the mean difference between test and retest values; the upper and lower lines characterize the upper and lower 95% limits of agreement (LOA = inter-trial mean difference ± 1.96 SD of the inter-trial difference), respectively. PD, Parkinson disease; LOA, limits of agreement.
