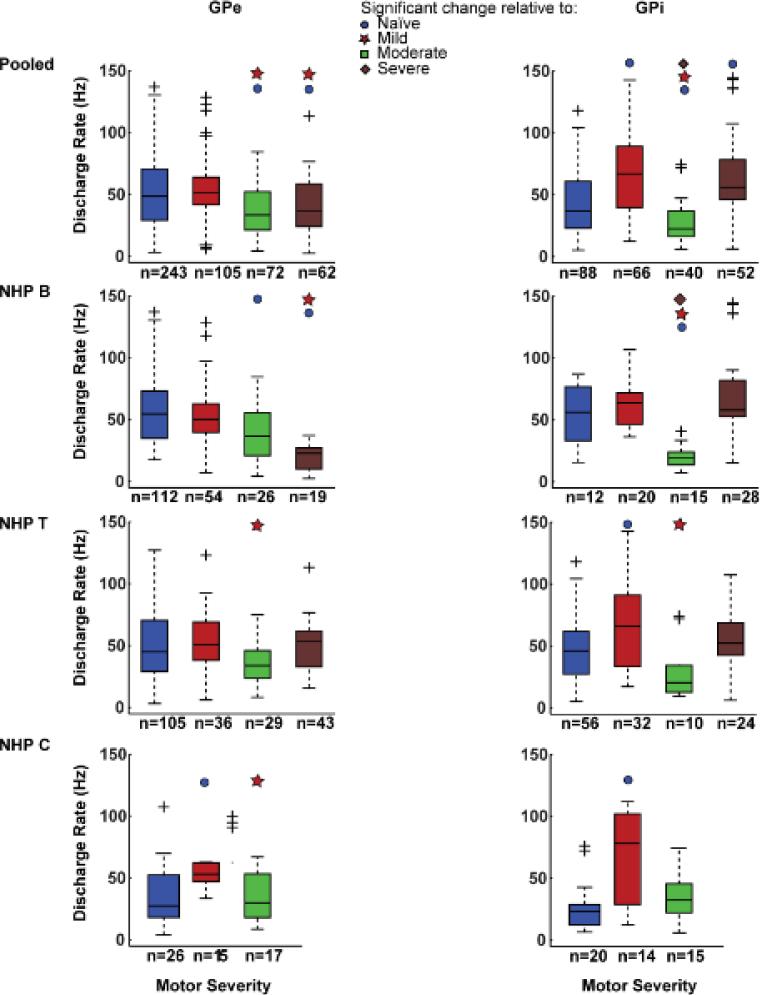
Figure 4. Spontaneous firing rates in the GPe and GPi did not exhibit a systematic change with motor severity.
Box and whisker plots characterizing the firing rate for neurons within the GPe (left) and GPi (right) pooled across all subjects (top row). Rows 2-4: the trends seen in the pooled data were not replicated in the data from individual subjects. Filled circle, star, square and diamond symbols indicate significant change relative to naïve, mild and moderate states at alpha = 0.05 with Bonferroni correction and the + sign indicates outliers.

