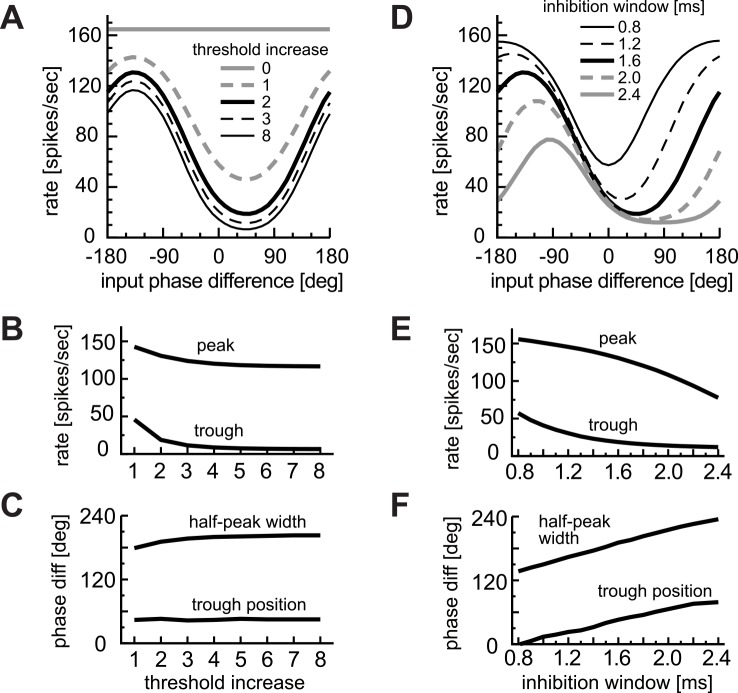
Fig 11. Effects of inhibition parameters on binaural phase coding.
A-C: Effects of the threshold increase δ. D-F: Effects of the inhibition window width Δ. A,D: Phase-tuning curves. B,E: Peak and trough rates of the phase tuning curves. C,F: Half-peak width and trough phase of the phase tuning curves.

