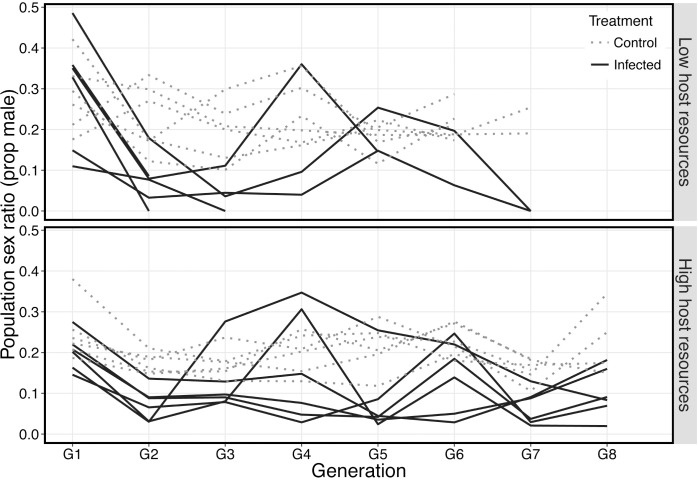
Fig 2. Sex ratio (proportion male) of populations of N. vitripennis in which superparasitism was permitted and host resources availability was high (top panel) or low (bottom panel).
Black lines are individual replicate populations that were infected with A. nasoniae, grey lines are replicate control populations. A. nasoniae infection and spread caused significant deviation in sex ratio compared to uninfected controls (See Table 1). Furthermore, sex ratio varied considerable among infected populations in the same treatment group in many generations. Each treatment was run in two separate blocks of 3 replicates of both control and infected populations. Control populations were no longer maintained when all of their contemporary infected populations either lost the infection or went extinct.

