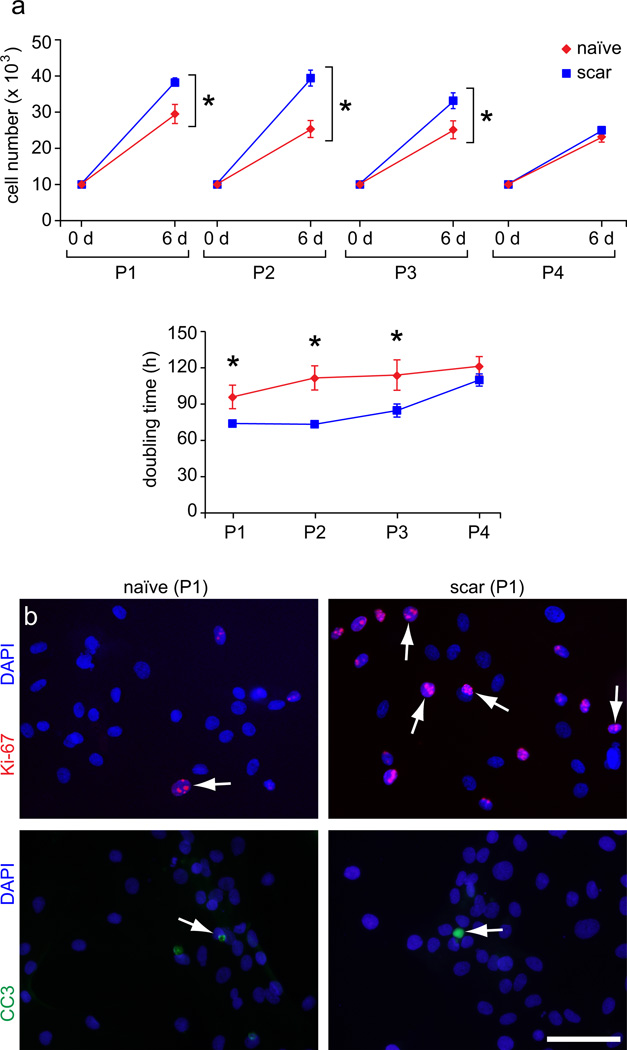
Figure 1. Scar VFFs exhibit increased proliferation at early passages.
(a) Cell count data showing greater proliferation of scar VFFs compared to naïve cells after 6 days (d) incubation at P1–P3. Corresponding population doubling times (in hours [h]) are also shown. (b) Representative ICC data showing Ki-67 (red) and CC3 (green) expression in naïve and scar VFFs at P1. Nuclei are counterstained with DAPI (blue). Ki-67+ cells were more abundant in the scar, compared to naïve, condition; no difference was observed for CC3. White arrows indicate Ki-67+ or CC3+ fibroblast nuclei. All experiments were performed with n = 4 biological replicates per condition. Data are presented as mean ± s.e.m. *, p < 0.05 in a. Scale bar = 100 µm in b.

