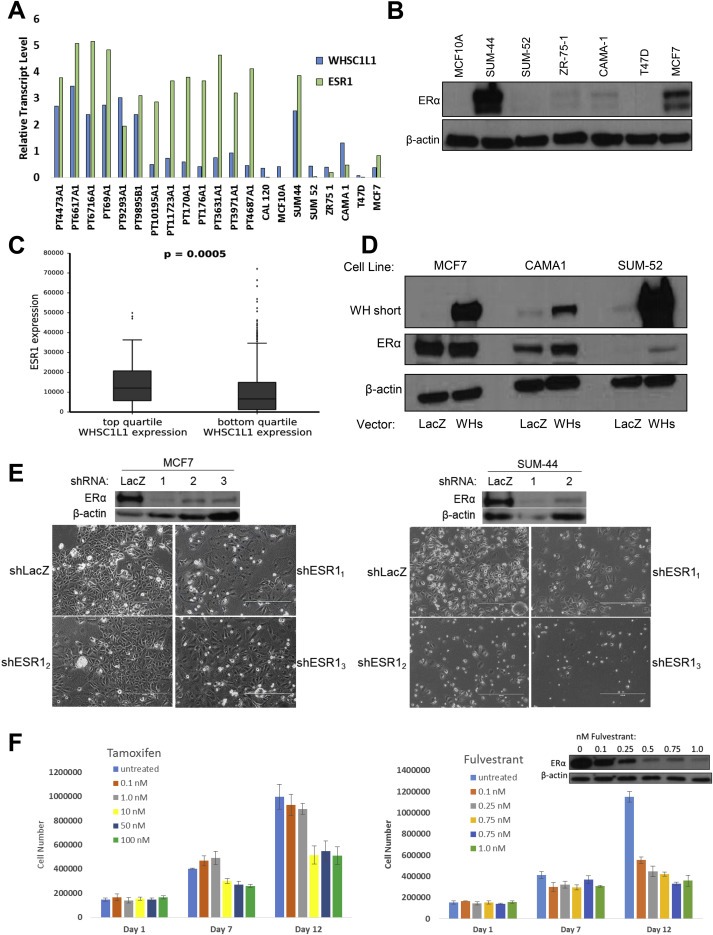
Figure 2.

A. WHSC1L1 and ESR1 transcript levels in breast cancer tissue samples and breast cancer cell lines with and without the 8p11‐p12 amplicon. B. Immunoblot showing ERα protein levels in a panel of breast cancer cell lines. C. Boxplot of RNAseqV2 transcript expression levels for TCGA breast cancer samples grouped by high or low WHSC1L1 expression. Samples were ranked based on WHSC1L1 expression and grouped by quartile. The top and bottom quartiles for WHSC1L1 gene‐level expression were used to plot ESR1 transcript levels as shown. Student's t‐test was performed to obtain a p‐value of 0.0005. D. Immunoblot showing expression of WHSC1L1‐short and ERα in three breast cancer cell lines following transduction with a lentiviral expression vector for the short isoform of WHSC1L1. E. MCF‐7 (left) or SUM‐44 (right) cells were transfected with either LacZ or three different ESR1 shRNAs and grown for 9 days in culture before being photographed. The western blots above each panel show the expression level of ERα at day 9 after infection (except for shESR13 in SUM‐44 cells, for which an insufficient amount of protein was obtained.) F. SUM‐44 cells were seeded in triplicate wells in 6‐well plates and treated with the indicated concentrations of tamoxifen (left) or fulvestrant (right) daily for 12 days. Additional wells were seeded and treated with the indicated concentrations of fulvestrant daily for 12 days prior to being harvested for western blot analysis of ERα expression (right, inset).
