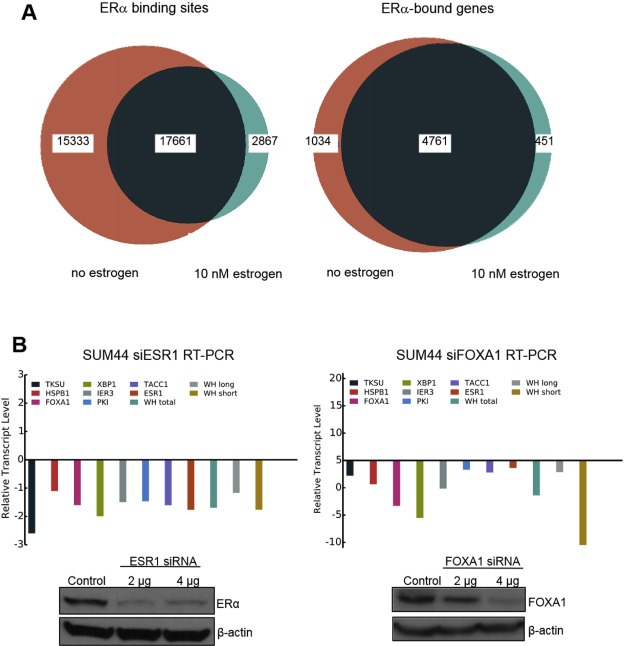
Figure 4.

A. Venn diagrams showing ERα binding sites (left) or ERα‐bound genes (right) in SUM‐44 cells under estrogen‐free conditions or following administration of 10 nM estrogen. B. RT‐PCR analysis of changes in the transcript levels of several ER‐bound genes upon siRNA‐mediated knock‐down of ESR1 (left) or FOXA1 (right). Western blots showing the protein expression levels of ESR1 and FOXA1 following siRNA transfection are shown below each graph.
