
Figure 5.
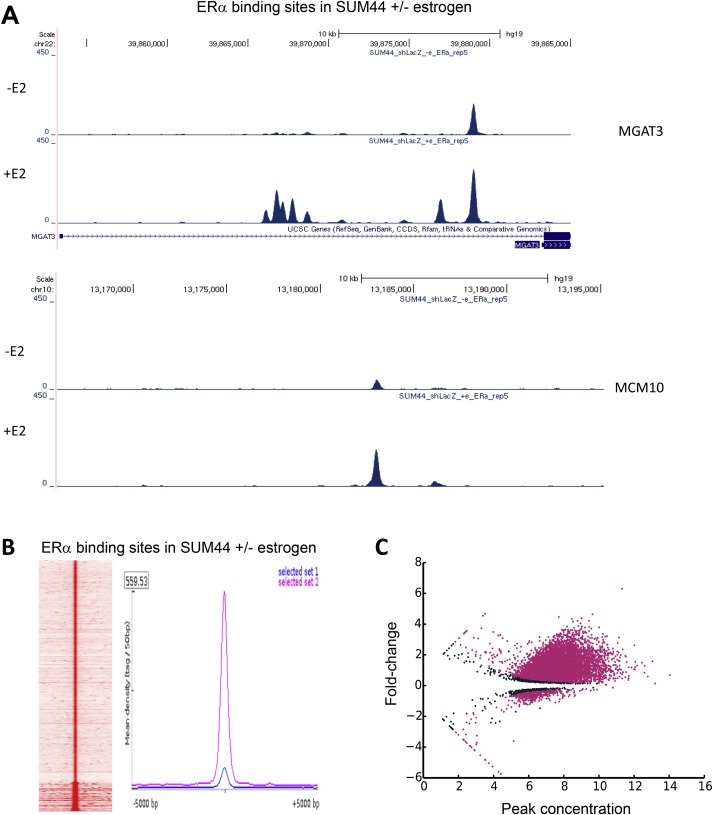
A. Genome traces showing the changes in several ERα binding regions in MGAT3 and MCM10 genes following treatment of SUM‐44 cells with 10 nM estrogen. B. Heatmap showing ERα peaks in SUM‐44 cells under estrogen‐free conditions and a mean‐profile plot of ERα peaks in SUM‐44 cells under 10 nM estrogen (magenta) and estrogen‐free (blue) conditions (left panel). C. MA‐plot showing results of ChIP‐Seq analysis of original peak intensity and fold‐change for significantly differentially‐bound ERα binding sites observed in the absence versus presence of estrogen in SUM‐44 cells. The y‐axis shows log2‐fold‐change in ERα binding intensity, and the x‐axis represents the initial peak intensity in the estrogen‐free control sample. Pink points represent significantly differentially‐bound peaks.