Figure 6.

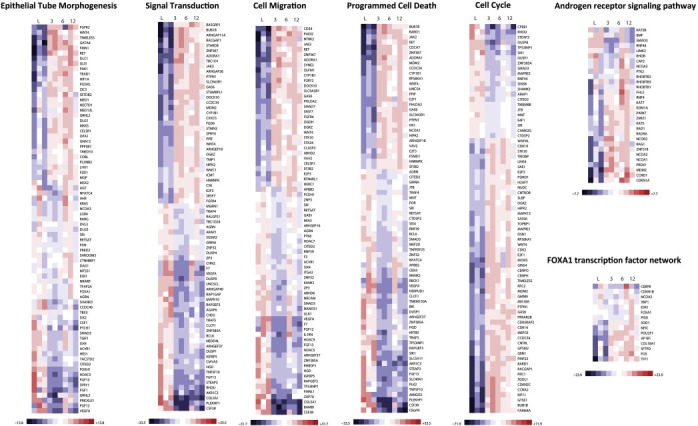
Heat maps showing the effect of estrogen treatment on the expression of ERα‐bound genes in SUM‐44 cells that map to selected biological processes and canonical pathways.

Heat maps showing the effect of estrogen treatment on the expression of ERα‐bound genes in SUM‐44 cells that map to selected biological processes and canonical pathways.