
Figure 2. Quantitative assessments of PCSK9 levels and correlations in subject with high Lp(a) levels.
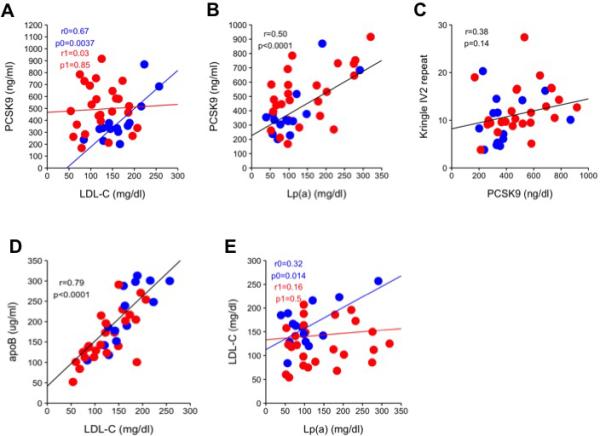
(A) Linear regression analysis of LDL-C and PCSK9 levels, adjusted to age, sex, and interaction with lipid-lowering medications. Blue regression analysis (r0, p0) = subjects without lipid-lowering medication, red regression analysis (r1, p1) = subjects on lipid-lowering medication. (B) Linear regression analysis of Lp(a) and PCSK9 levels, adjusted to age and sex. (C) Linear regression analysis of PCSK9 levels and the average number of kringle IV-2 repeats, adjusted to age and sex. (D) Linear regression analysis of LDL-C and apoB levels, adjusted to age and sex. (E) Linear regression analysis of LDL-C and Lp(a) levels, adjusted to age, sex, and interaction with lipid-lowering medications. Blue regression analysis (r0, p0) = without lipid-lowering medication, red regression analysis (r1, p1) = on lipid-lowering medication. For all panels, blue = subjects without lipid-lowering medication, red = subjects on lipid-lowering medication, black regression lines represents the combined regression of both blue and red dots and indicate no interaction with lipid-lowering medications.