
Figure 3. Association of PCSK9 with Lp(a) in subjects with high Lp(a) levels.
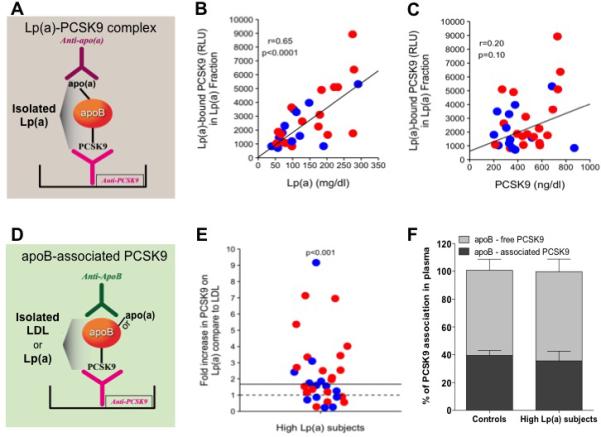
(A) Illustration of the ELISA method used to detect Lp(a)-bound PCSK9. (B) Linear regression analysis of levels of Lp(a) and Lp(a)-bound PCSK9, adjusted for age and sex. (C) Linear regression analysis of levels of PCSK9 and Lp(a)-bound PCSK9, adjusted for age and sex. (D) Illustration of the ELISA method used to detect apoB-associated PCSK9 in LDL and Lp(a) fractions. (E) Fold increase in levels of Lp(a)-bound PCSK9 over LDL-bound PCSK9, measured as apoB-bound PCSK9 (ELISA) and normalized for apoB level in each fraction. (F) Percentage of apoB-associated PCSK9 in plasma of subjects with high Lp(a) levels vs. those with low Lp(a) levels (groups matched for plasma LDL-C levels). All panels: blue = subjects without lipid-lowing medication, red = subjects on lipid-lowering medication, black regression lines represent the combined regression of both blue and red dots and indicate no interaction with lipid-lowering medications.