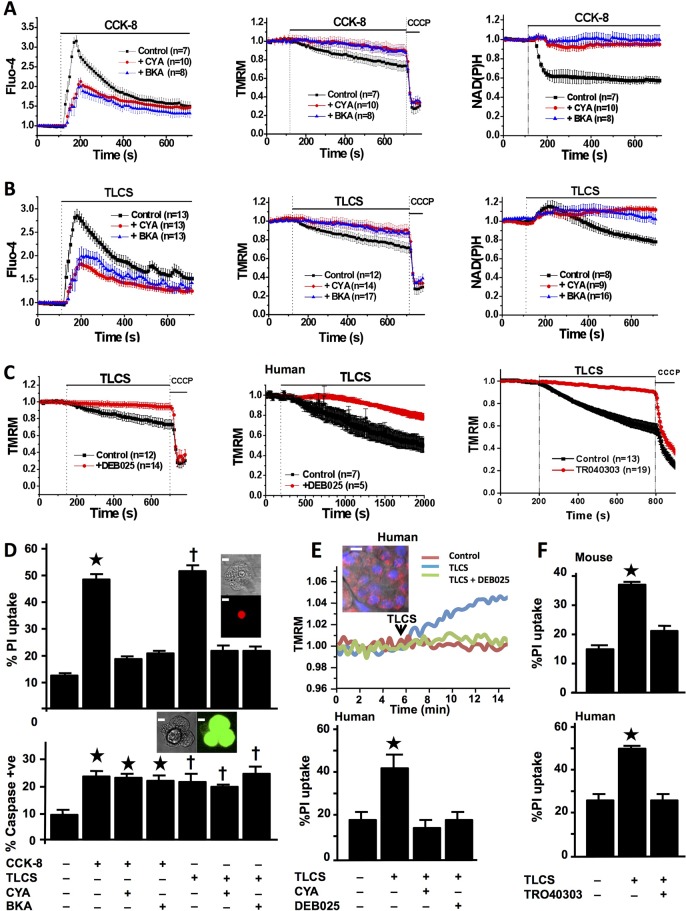
Figure 1.
Mitochondrial permeability transition pore (MPTP) inhibitors prevent mitochondrial impairment and necrosis of freshly isolated murine and human pancreatic acinar cells (confocal fluorescence; mean±SEM ratio to basal, F/F0; n=no. of experiments). (A) Cholecystokinin-8 (CCK-8) (10 nM) induced large cytosolic calcium elevations (Fluo-4, left), falls in Δψm (tetramethyl rhodamine methyl ester, TMRM; positive control, protonophore carbonyl cyanide m-chloro phenyl hydrazone, CCCP, middle) and NAD(P)H autofluorescence (right), showing protection of Δψm and NAD(P)H by cyclosporin A (CYA, 5 µM) or bongkrekic acid (BKA, 50 µM) (pretreatment for 30 min at room temperature during loading of fluorescent dyes). (B) Taurolithocholic acid sulfate (TLCS) (500 µM) induced similar changes in calcium, Δψm and NAD(P)H, with similar protection by CYA and BKA. (C) Protection of Δψm from TLCS (500 µM) by pretreatment with DEB025 (100 nM) in murine (left) and human (middle) pancreatic acinar cells, and with TRO40303 (10 μM, right) in murine cells. (D) CYA or BKA protected cells from early plasma membrane rupture (top, % cells showing propidium iodide (PI) uptake as inset; *p<0.05 CCK-8 vs control or with inhibitor; †p<0.05 TLCS vs control or with inhibitor) but not from caspase activation (bottom, % cells showing general caspase substrate fluorescence as inset; *p<0.05, control vs all CCK-8 groups; †p<0.05 control vs all TLCS groups; white bars=5 μm). (E) Typical rise in TMRM dequench fluorescence31 emitted by normal fresh human pancreatic tissue slice in response to TLCS (500 μM) and protection by DEB025 (100 nM; upper panel; inset shows confocal image of human pancreatic tissue slice (mitochondrial (TMRM, red) and nuclear (Hoescht, blue) fluorescent dyes, white bar=15 μm). Lower panel shows protection from TLCS-induced PI uptake in human pancreatic acinar cells by CYA (100 nM) or DEB025 (100 nM, bottom) and (F) murine (top) and human (bottom) cells by TRO40303 (10 μM) (*p<0.05 TLCS vs control or with CYA, DEB025 or TRO40303).

