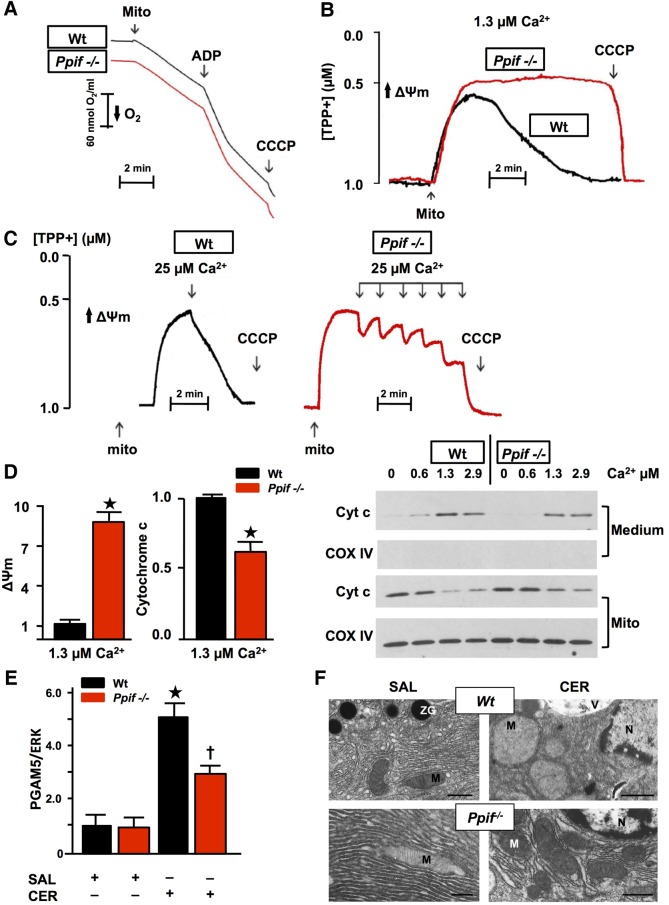
Figure 4.
Genetic mitochondrial permeability transition pore (MPTP) inhibition confers resistance of pancreatic mitochondria to calcium-induced loss of Δψm and PGAM5 induction. (A) Representative Clark-type electrode measurement of oxygen consumption showed no difference between wild type (Wt) and Ppif−/− mitochondria (Mito; succinate=10 mM, ADP=200 μM, carbonyl cyanide m-chlorophenyl hydrazone (CCCP)=2 μM). (B) Typical TPP+-selective electrode measurement of Δψm with succinate (10 mM) in free ionised calcium clamped at 1.3 µM (calcium/ethylene glycol tetraacetic acid buffers) for 10 min and (C) during pulses of calcium (25 µM), showing resistance of Ppif−/− mitochondria to loss of Δψm. (D) Δψm (TPP+-selective electrode, left) and cytochrome c (Cyt c; densitometry from Medium immunoblot, right) in the same preparations, normalised to Wt. Ppif−/− pancreatic mitochondria release Cyt c but less than Wt (*p<0.05, means±SEM from >3 preparations), as shown in representative Cyt c immunoblot of medium and mitochondrial pellet (Mito, Cox IV confirmed separation and equal protein loading). (E) Increase in PGAM5 in Wt caerulein acute pancreatitis (CER-AP) pancreata was significantly reduced in Ppif−/− with representative immunoblot (re-probed for ERK1/2 to confirm equal loading; each lane from an individual animal; 4–6 mice per group; densitometry of PGAM5 as ratio of band intensities to ERK in each sample normalised to saline-treated Wt controls, means±SEM; *p<0.01 CER-AP in Wt vs Wt controls, †p<0.05 CER-AP in Ppif−/− vs CER-AP in Wt). (F) Electron micrographs of pancreata showing Wt and Ppif−/− pancreatic acinar cells after induction of CER-AP compared with saline (SAL) controls. Wt pancreatic acinar mitochondria are markedly swollen with loss of cristae in CER-AP compared with normal morphology of Ppif−/− pancreatic acinar mitochondria in CER-AP and in both Wt and Ppif−/− saline controls (M, mitochondrion; N, nucleus; V, vacuole; ZG, zymogen granule; black bars 1 μm except top right, 2.5 μm).

