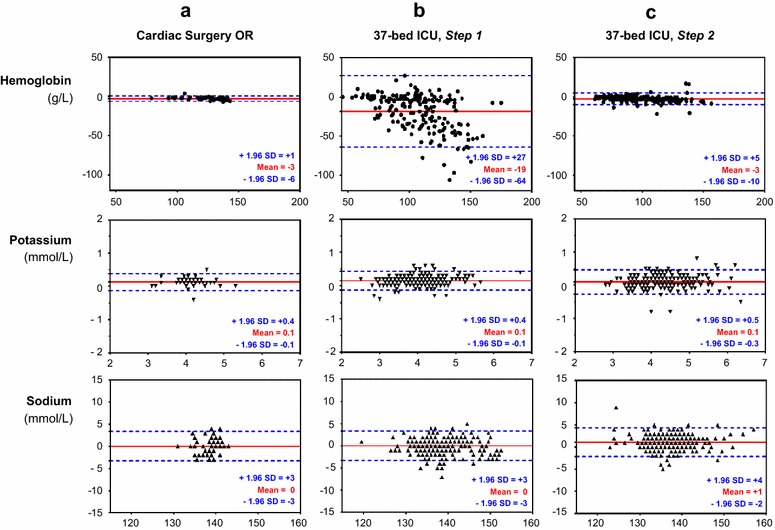
Fig. 1.

Bland–Altman plots for the comparisons between each method for estimating the hemoglobin, potassium, and sodium concentrations. Comparisons of the analyses were performed in a cardiac surgery operative room (OR), b polyvalent intensive care unit of 37 beds (37-bed ICU). The preanalytical process of the 37-bed ICU was improved according to the multidisciplinary quality approach, and a second run of comparisons was performed in this critical care unit (c). The solid red line in each Bland–Altman plot indicates the mean difference (bias) between the methods (value from the central laboratory − value from blood gas analyzer delocalized in the intensive care unit); the broken blue lines indicate the 95 % limits of agreement
