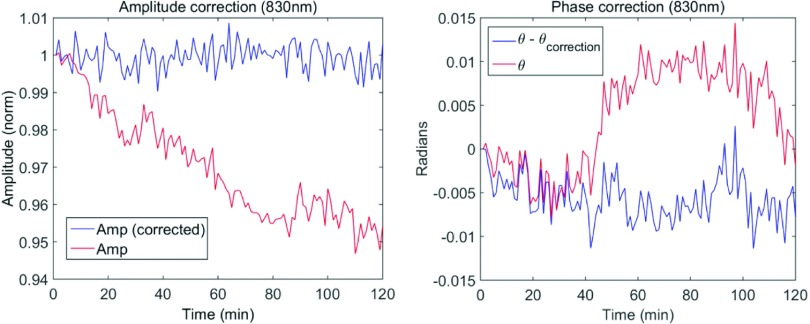
FIG. 5.
Time series data showing real-time data normalization methods used for the amplitude (left) and phase (right). The red curve is the uncorrected signal, and the blue curve is the corrected curve. The amplitude is corrected using the calibration source and the phase is corrected with the phase calibration channel. The data here are actually down-sampled signals, i.e., they are obtained by averaging over four adjacent pixels. (See color online version.)

