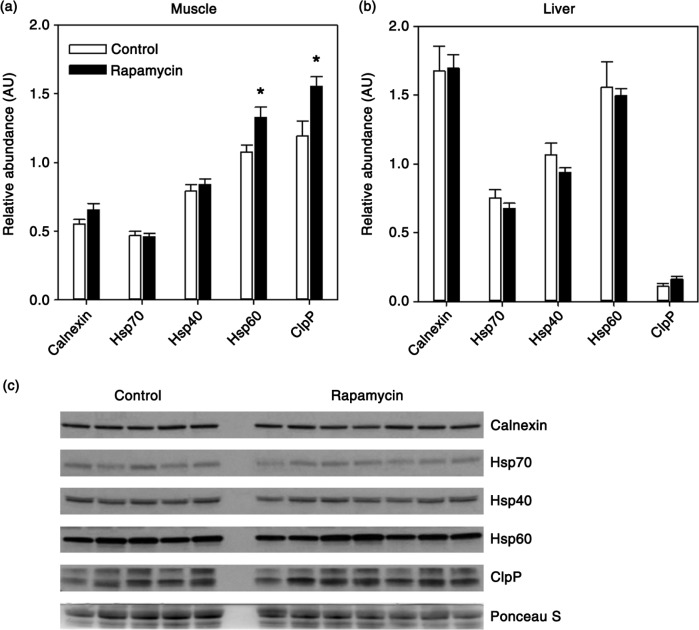
Fig. 3.
Quantification of relative levels of indicated molecular chaperones in skeletal muscle (a) or liver (b) from control (n = 5) and rapamycin-treated (n = 7) marmosets. Data are presented as mean values (± SEM) for indicated groups. Data are presented as values for each protein normalized using Ponceau S staining of immunoblot as a loading control. Asterisks represent p < 0.05 for Student's t-test comparing control to rapamycin values. (c) Representative immunoblot for skeletal muscle data presented in (a).

