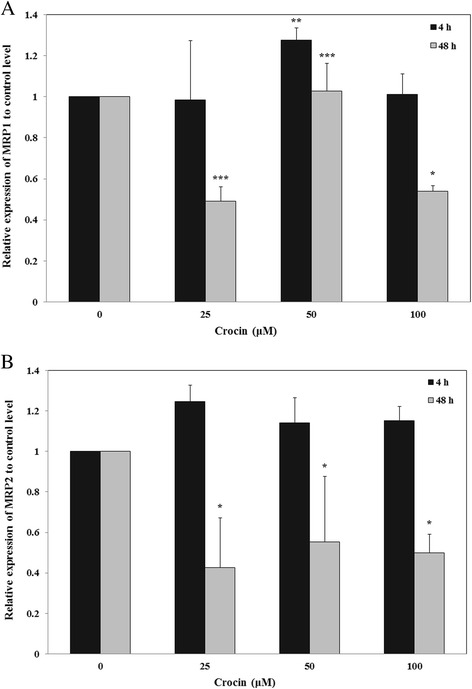
Fig. 3.

The effects of crocin on the levels of MRP1 (a) and (b) mRNA in the A2780/RCIS cell line. Cells were treated for 4 and 48 h with crocin (0–100 μM), and MRP1 and MRP2 mRNA expressions were measured by real-time RT-PCR using total RNA extracted from control and treated cells. Values were normalized to the β-actin content of the samples. The results were expressed as the target/reference ratio of the treated samples divided by the target/reference ratio of the untreated control sample and expressed as mean ± SD (n = 3); *, p < 0.05; **, p < 0.01; ***, p < 0.001
