
Fig. 2.
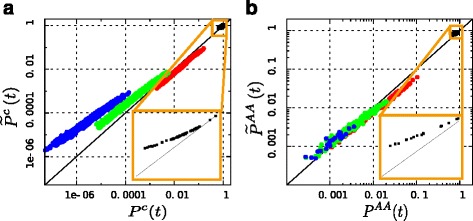
Comparison between Markovian and non-Markovian substitution probabilities in the framework of codons and of amino acids. a Points: entry-by-entry comparison of P c(t) and in log-log scale, with t=0.235. Each point corresponds to a pair i,j of codons and its x-value is given by , while its y-value is . The black squares (zoomed in the yellow inset) are the entries with i=j, while red, green and blue points are respectively the entries where codon i and codon j differ by one, two or three nucleotides. Solid line: line y=x. b Points: entry-by-entry comparison of P AA(t) and in log-log scale, with t=0.23. Coordinates and lines have the same meaning as in panel (a) and colors are such that the entries where i=j are black (zoomed in the yellow inset), while red, green and blue identify the entries with i≠j where the most similar pair of codons coding for amino acids i and j differ respectively by one, two or three nucleotides