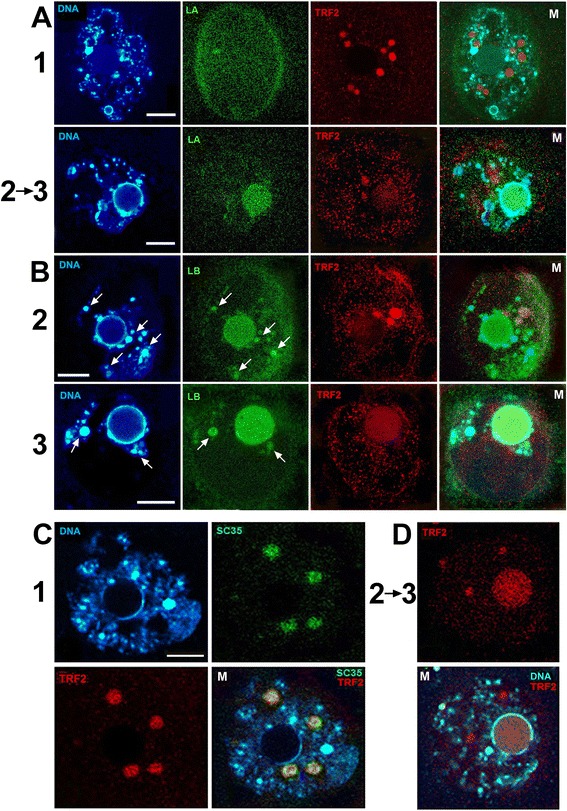
Fig. 6.

Double immunofluorescence of oocytes nuclei with TRF2 AB (red) and other ABs (green). Oocyte stages are indicated at the left for each panel (a, b, c, d). A – AB against Lamin A; B - AB against Lamin B. 1st image in each row – DAPI (DNA), M – merged images. C – staining is indicated on each image; D – TRF2 and DAPI staining of the nucleus progressing from stage 2 to stage 3. Bar 10 μm for all images
