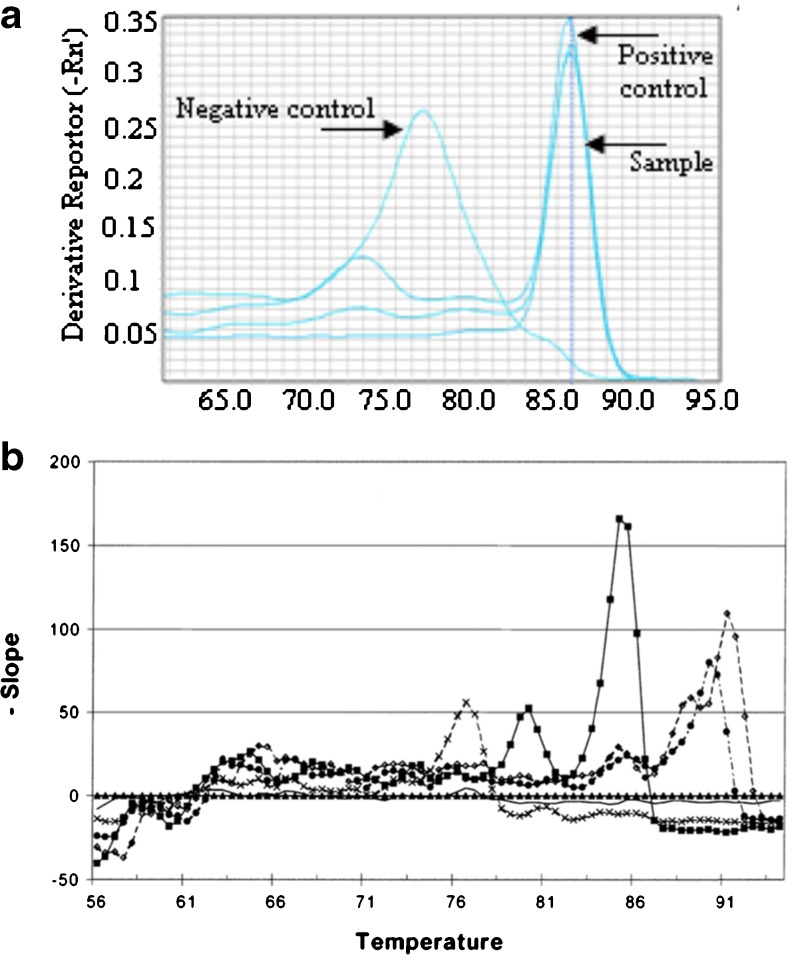
Fig. 5.
a Melting curve analysis of RT-PCR of soybean oil (80 ml) (adapted from He et al. 2013) shows a lower Tm peak for the negative control which indicates the presence of primer-dimer. b Melting curve analysis of triplex RT-PCR assay for the detection of L. monocytogene, E. coli and S. typhimurium. Different Tm values for each target allows multiplex RT-PCR detection (adapted from Bhagwat 2003)

