
Fig. 1.
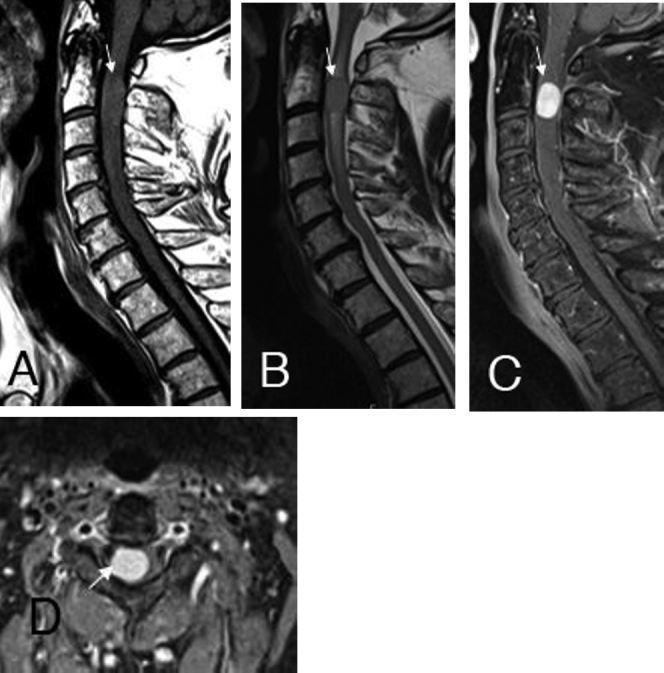
The sagittal T1- (A) and T2-weighted (B) images and the postcontrast sagittal (C) and axial (D) fat-suppressed T1-weighted images clearly show the intramedullary, paracentral right located, expansive melanocytoma at the C2 / C3 level with homogeneous contrast enhancement. Additionally, a T2w hyperintense (B) per focal tumoral edema was noticed, suggestive of myelopathy.