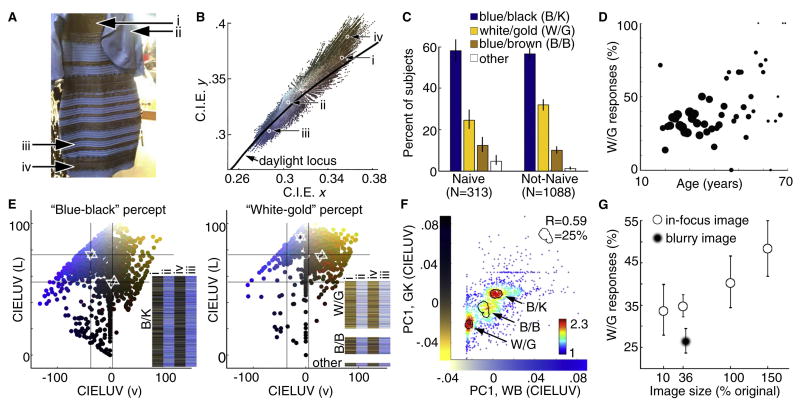
Figure 1.
Striking differences in color perception of The Dress. (A) Original photograph, reproduced with permission from Cecilia Bleasdale. (B) Pixel chromaticities for the dress. (C) Histogram of color descriptions, for naïve (N=313) and non-naive (N=1088) subjects. Error bars are 95% C.I. (D) Of subjects who reported W/G or B/K (N=1221), the odds of reporting W/G increased by a factor 1.02 per unit age, p=0.0035, 95% C.I. [1.01-1.03] (Table S1). Symbol size denotes number of subjects (largest dot=76; smallest dot=1). (E) Color matches for regions i-iv (panel A), sorted by color description (B/K, left; W/G, right). Symbols show averages (upward triangles, regions i and ii; downward triangles, regions iii and iv), and contain 95% C.I.s of the mean. Grid provides a reference across the B/K and W/G panels. Insets depict color matches for individual subjects in each row, sorted by description. (F) Color matches for region (i) plotted against matches for region (ii) for all subjects (R=0.59, p<0.0001). Contours contain the highest density (25%) of respondents obtained in separate plots (not shown) generated by sorting the data by description (B/K, W/G, B/B). The first principal component of the population matches to (i, iv) defined the y axis (gold/black, “GK”); the first PC of the population matches to (ii, iii) defined the x axis (white/blue, “WB”). Each subject’s (x,y) values are the PC weights for their matches (Supplementary Experimental Procedures). Color scale is number of subjects. (G) Among W/G or B/K respondents, percent of W/G responses increased with image size (N=235, 10%; N=1223, 36%; N=245, 100%; N=215, 150%; p < 0.0001, OR=1.004 [1.002-1.007]). The horizontal dimension of the image was about 2°, 7.2 °, 20°, and 30° of visual angle. Blurring the image biased responses towards B/K (N=1048, image was 41% of original size; image was 260×401pixels with a 0.11° pixel radius Gaussian bl ur; Chi-square, p<0.0001).

