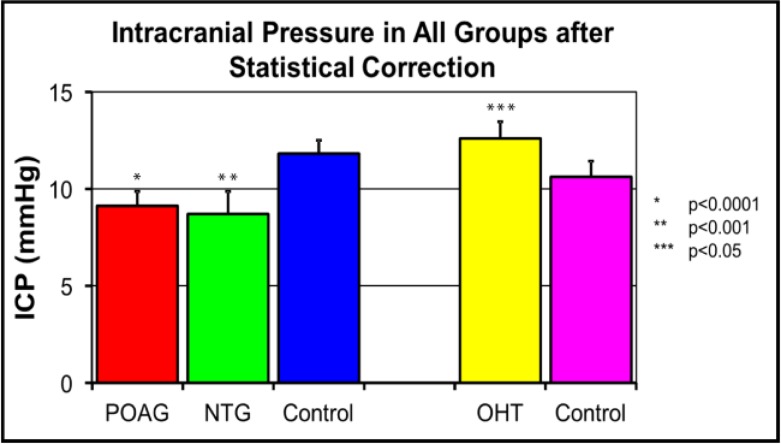
Figure 2.
Statistically corrected intracranial pressure across various groups of glaucoma and ocular hypertension (OHT), in comparison to respective controls.ICP was significantly lower in POAG and NTG groups and higher in OHT patients. Reprinted from Berdahl et al. (18).

