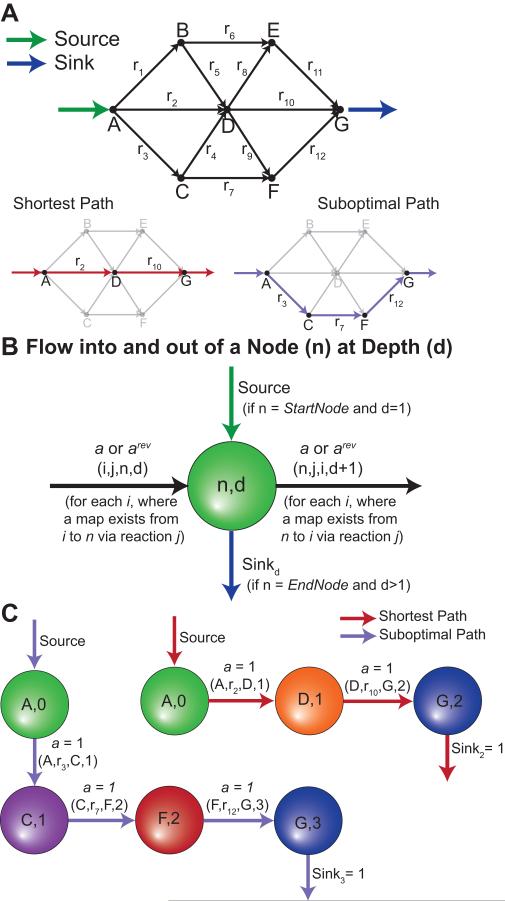
Figure 3. Illustrative Example for Generating Paths.
(Panel A) PathTracer was applied to a toy network to find all reaction paths from metabolite A to G. (Panel B and C) One source edge (green arrow) was added to the starting metabolite’s first depth node. Sink edges (blue arrows) were added to the ending metabolite’s nodes with depths greater than one. (Panel B) The flow inputs and outputs of a given node (n) at depth (d) are based on source edges, sink edges, connections to other nodes (i) based on metabolite maps (e.g., CTMs). PathTracer balanced flow around each node to determine the shortest reaction path from the source edge to a sink edge (Panel C). Here the red path indicates the shortest possible path between A and G, while the purple path indicates an alternate solution that was found with integer cuts.

