
Figure 3. SHAPE-Seq reveals reactivity changes in the presence of ligand for the thiM TPP riboswitch aptamer domain.
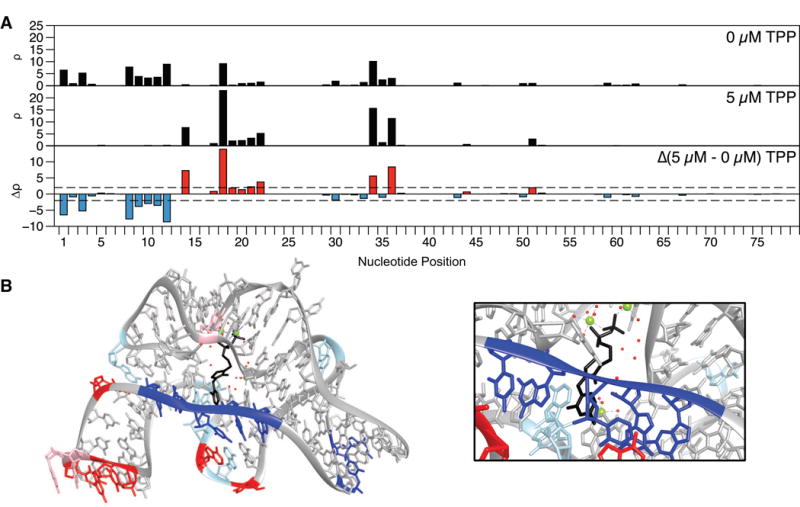
(A) in vitro reactivity maps for the thiM TPP aptamer domain with 0 μM or 5 μM TPP (both conditions RMDB: TPPSC_1M7_0005). The reactivity difference map (bottom) shows increases (red) and decreases (blue) in reactivity in the presence of ligand. (B) Crystal structure (PDB 2GDI) [60] of the thiM TPP aptamer domain with TPP (black) bound, colored by change in reactivity in the presence of ligand from part A. Magnesium ions are colored light green and the solvent is denoted as red dots. Nucleotides marked in red/blue show increases/decreases above |Δρ| ≥ 2 (dashed lines in part A). Light red and blue mark changes for which 1 < |Δρ| < 2. The region closing the TPP binding pocket shows a cluster of nucleotides that become less flexible upon ligand binding (inset). An extra ‘G’ was added to the 5′ end to aid in vitro transcription and is not displayed.