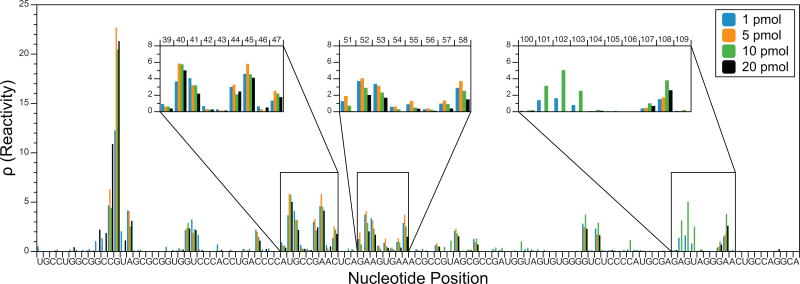
Figure 7. Comparison of in vitro folded 5S rRNA reactivity maps from different amounts of starting RNA.
The same in vitro SHAPE-Seq experiment was performed using either 1, 5, 10, or 20 pmol of starting RNA (RMDB: 5SRRNA_1M7_0009). As expected, all of the reactivity maps are very similar, although there is some disagreement near positions 102–104 (right inset). However, these differences do not show a trend with increasing/decreasing starting RNA level and are thus likely experimental noise.

