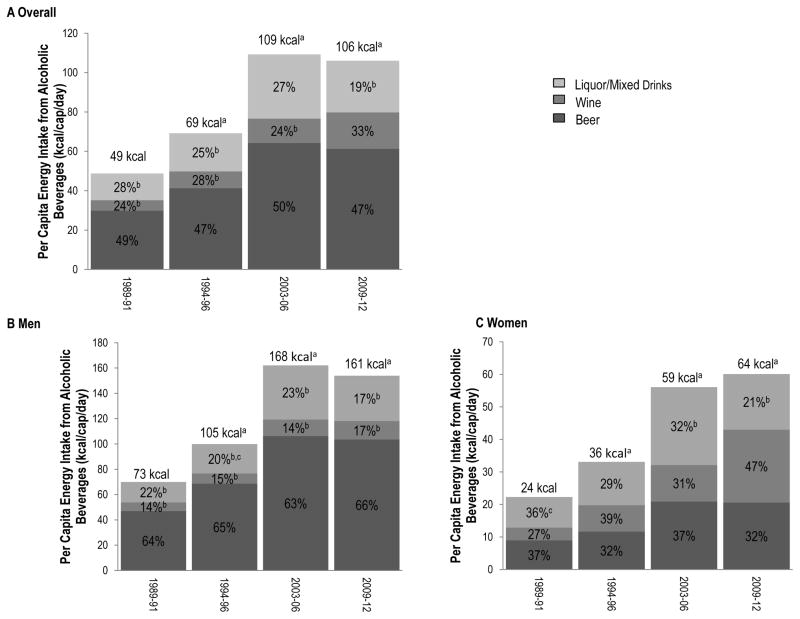
Figure 1. Per capita energy intake from alcoholic beverages and percent contribution by beverage type to total alcoholic beverage energy intake overall and by sex, 1989–2012.
Panel labels:
- Overall
- Men
- Women
Data for adults (≥19 y) who reported dietary intake on day 1 of diet assessment from the Continuing Survey of Food Intakes by Individuals (CSFII) 1989–91, CSFII 1994–1996, the National Health and Nutrition Examination Survey (NHANES) 2003–2006, and NHANES 2009–2012 (N= 39,298). Percentages indicate the contribution of beer, wine or liquor/mixed drinks kcal/d to energy intake from alcoholic beverages at each survey year and are calculated at the person level; percentages are the mean percent contribution and may differ from percentages calculated by the population ratio method. Differences were considered statistically significant at P<0.05, after Bonferroni correction for multiple comparisons. a Significantly different than 1989–1991 (P<0.001); b Within year different than beer (p<0.05); c Within year different than wine (p<0.05).

