Abstract
Nanoparticle (NP)-based approaches to cancer drug delivery are challenged by the heterogeneity of the enhanced permeability and retention (EPR) effect in tumors and the premature attrition of payload from drug carriers during circulation. Here we show that such challenges can be overcome by a magnetophoretic approach to accelerate NP delivery to tumors. Payload-bearing poly(lactic-co-glycolic acid) NPs were converted into polymer–iron-oxide nanocomposites (PINCs) by attaching colloidal Fe3O4 onto the surface, via a simple surface modification method using dopamine polymerization. PINCs formed stable dispersions in serum-supplemented medium and responded quickly to magnetic field gradients above 1 kG/cm. Under the field gradients, PINCs were rapidly transported across physical barriers and into cells and captured under flow conditions similar to those encountered in postcapillary venules, increasing the local concentration by nearly three orders of magnitude. In vivo magnetophoretic delivery enabled PINCs to accumulate in poorly vascularized subcutaneous SKOV3 xenografts that did not support the EPR effect. In vivo magnetic resonance imaging, ex vivo fluorescence imaging, and tissue histology all confirmed that the uptake of PINCs was higher in tumors exposed to magnetic field gradients, relative to negative controls.
Keywords: Polymer-iron oxide nanocomposite, magnetic drug delivery, polymeric nanoparticles, polydopamine, in vivo delivery
1. INTRODUCTION
Nanoparticles (NPs) are being actively investigated as carriers to alter the pharmacokinetics and biodistribution of their drug payloads, enhance their accumulation in tumors, and lower the effective dose and subsequent adverse side effects. Most NP-based strategies rely on distinct features shared by rapidly growing tumors for selective access, namely the hyperpermeable vasculature for extravasation and the impaired lymphatic drainage for retention [1, 2]. This phenomenon, commonly referred to as the enhanced permeability and retention (EPR) effect, has been a key principle in nanomedicine research and a driver of clinical development of therapeutic products [3–5]. However, recent evidence indicates the EPR effect to be a highly heterogeneous phenomenon, which varies with the types and stages of tumors, individuals, and even locations within the same patient [6, 7]. This has led many to reconsider the universality of the EPR effect as a precept for clinical drug delivery [8–11]. Moreover, the EPR effect is time-dependent and requires a long-term (12–24 hours) circulation of NPs with stable encapsulation of a drug [6], which places significant burden on the balance between drug retention and release [12]. Given these challenges, additional means to leverage the EPR effect are needed to enhance the delivery of NPs to tumors.
We hypothesize that magnetophoresis can expedite the extravasation and transport of NPs into tumors, and thereby surmount intrinsic limitations of the EPR effect as well as the capacity of NP drug carriers. Magnetophoretic drug delivery employs an external field gradient to concentrate magnetically responsive particles at the site of disease to provide sufficient ability to overcome shear forces during blood flow and physical barriers that can hinder transport into tissues of interest [13–15]. Magnetophoresis has long been pursued as a way of improving target specificity of drug delivery in the form of a drug bound to magnetic particles, or a drug co-loaded with magnetic particles in a carrier, with several preclinical studies supporting proof of concept [16–20] and positive safety profiles in humans [21].
In this study, we chose poly(lactic-co-glycolic acid) (PLGA) NPs as a drug carrier due to the positive safety track record yet the previously identified limitations in retaining a drug in physiological fluid [22, 23]. Colloidal magnetite (Fe3O4) was used as a component to enable magnetophoretic acceleration of NP delivery due to the ease of synthesis, stability and dispersion control, and magnetization (up to 90 emu/g, depending on domain size) [24] as well as the reputation for relatively low toxicity [25]. Colloidal Fe3O4 may be co-encapsulated with an active drug ingredient in the PLGA NPs but can compete for space and limit room for drug loading. In our preliminary studies using poly(lactic-co-glycolic acid) (PLGA) NPs, we observed that the co-encapsulation of Fe3O4 and paclitaxel (PTX) compromised drug loading and retention in PLGA NPs. To bypass this challenge and enable modular control of core and surface engineering, we considered affixing Fe3O4 on the surfaces of PLGA NPs already loaded with a drug, using a simple surface modification technique inspired by mussel foot proteins. This technique involves the formation of a polymerized dopamine (pD) layer on the surface of polymeric or inorganic materials [26]. We have shown that the pD layer serves as a cement to immobilize various ligands including small molecules and polymers on PLGA NPs [27].
Capitalizing on the flexibility and simplicity of this technique, we affix colloidal Fe3O4 on the PLGA NPs via the pD layer and produce magnetically responsive nanocarriers that can support the rapid transport and delivery of payloads under magnetophoretic conditions. These polymer–iron oxide nanocomposites (PINCs) are evaluated under in vitro conditions mimicking the flow rates and interstitial transport in the tumor vasculature and also in vivo using a solid tumor model with limited EPR potential. We find that local magnetic field gradients can increase the accumulation of PINCs by nearly three orders of magnitude and enhance their uptake into cells and tumors at rates not possible under normal convective conditions.
2. MATERIALS AND METHODS
2.1. Materials
All biochemical reagents were purchased from Sigma-Aldrich (St. Louis, MO) unless otherwise specified. 5-nitrobenzoxadiazolyl (NBD)-conjugated cholesterol (C*) was purchased from Avanti Polar Lipids (Alabaster, AL). PLGA 85:15 (150 kDa) was purchased from Akina, Inc. (West Lafayette, IN). Dopamine-HCl was purchased from Alfa Aesar (Ward Hill, MA). 3-(4,5-Dimethylthiazol-2-yl)-2,5-diphenyltetrazolium bromide (MTT), Hoechst 33342, and LysoTracker were purchased from Invitrogen (Eugene, OR), and CellMask Deep Red was purchased from Life Technologies (Carlsbad, CA). Phosphate buffered saline (PBS, pH 7.4) and 10 mM Tris buffer (pH 8.5) were prepared by standard protocols. Deionized (DI) water was obtained from an ultrafiltration system (Milli-Q, Millipore) with a resistivity >18 MΩ·cm, and passed through a 0.22-µm filter to remove particulate matter.
2.2. Preparation and characterization of NPs (Scheme 1)
Scheme 1.
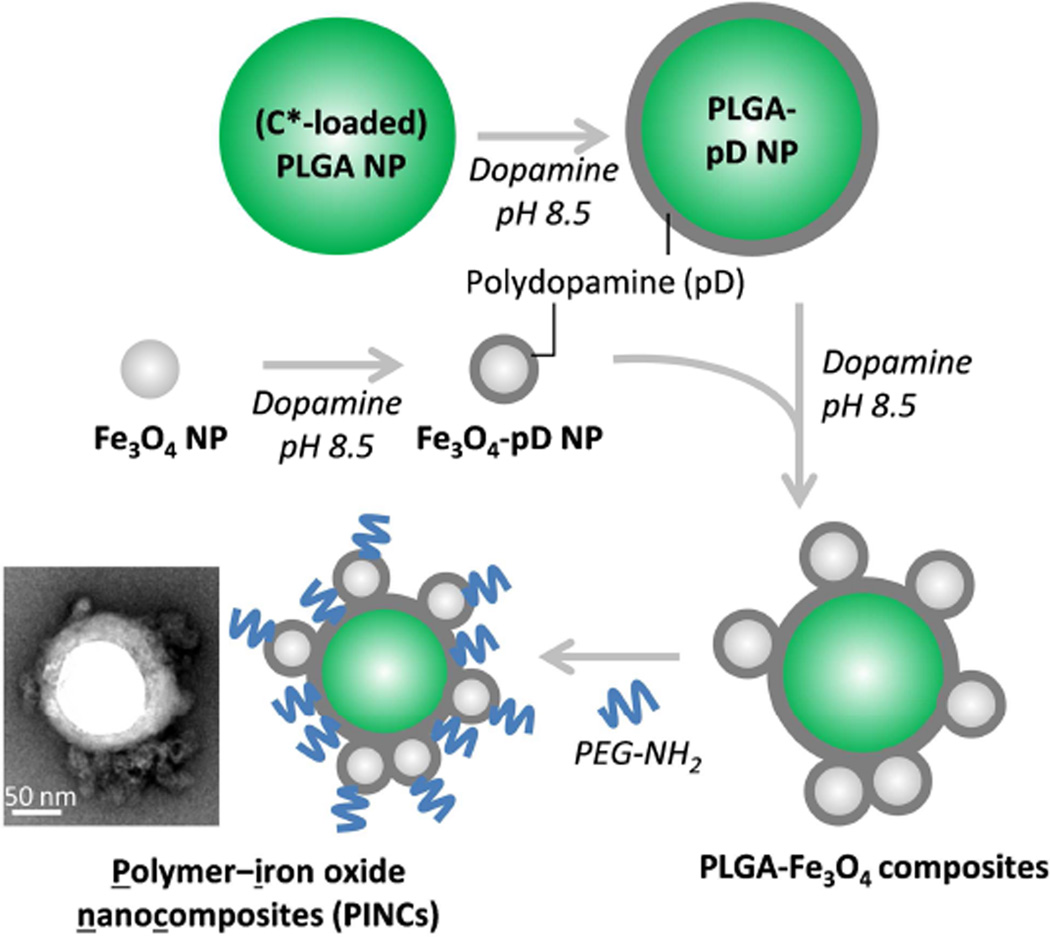
Preparation of polymer–iron oxide nanocomposites (PINCs).
Preparation of PLGA nanoparticles coated with polydopamine (PLGA–pD NPs)
PLGA NPs were prepared by the single-emulsion method. Fifty milligrams of PLGA was dissolved in 4 mL of CH2Cl2 and mixed with 50 µL of 1 wt% C* in CHCl3. This was added to 10 mL of 4 wt% aqueous polyvinyl alcohol (PVA) and emulsified by an immersible ultrasonic probe (Sonics Vibracell, Newtown, CT) for 2 min at 0 °C, pulsing at a power level of 7 W and a 2:1 duty cycle every 6 sec. The emulsion was added to 20 mL of DI water and stirred for 8 hours to remove CH2Cl2. The PLGA NPs were collected by centrifugation at 16,000 rcf for 60 min at 4 °C, and washed twice with DI water.
An aqueous slurry of 0.1 wt% PLGA NPs (1 mL) was treated with an equal volume of 0.1 wt% dopamine-HCl in Tris buffer and gently mixed on an orbital shaker for 3 hours at room temperature to generate a surface layer of polydopamine (pD) on the NPs. The PLGA–pD NPs were collected by centrifugation at 13,000 rpm for 30 min at 4 °C, then redispersed as a 2 wt% slurry.
Preparation of polydopamine-coated Fe3O4 nanoparticles (Fe3O4–pD NPs)
Fe3O4 NPs (1.2 g) were prepared by coprecipitation, with an average particle size of 15 nm by TEM analysis. Briefly, 1.62 g of FeCl3·6 H2O and 0.99 g of FeCl2·4 H2O were dissolved in 40 mL of DI water with magnetic stirring. Subsequently, 5 mL of 28% NH4OH was injected quickly into the reaction mixture and allowed to stir for 10 min. The colloidal Fe3O4 was precipitated with a handheld NeFeB magnet, subjected to 3 cycles of redispersion in DI water followed by magnetic precipitation, then dried in air. A portion of freshly prepared Fe3O4 NPs (4 mg) was added to 0.1 wt% dopamine-HCl in Tris buffer (4 mL) and gently mixed for 30 min. The Fe3O4-pD NPs were collected by a handheld magnet, then redispersed as a 0.4 wt% solution in fresh Tris buffer and used immediately.
Preparation and characterization of polymer–iron oxide nanocomposites (PINCs)
A slurry of 2 wt% PLGA-pD NPs (1 mL) was added to four volumes of 0.1 wt% fresh dopamine-HCl in Tris buffer, followed by one volume of 0.4 wt% Fe3O4–pD NPs in Tris buffer. The suspension was agitated for 2 hours by vortex mixing at room temperature, then further homogenized by treatment with an immersible ultrasonic probe for 15 min (50% duty cycle every 4 s). The PLGA–Fe3O4 composites were collected with a handheld magnet and redispersed as a 2 wt% slurry in fresh Tris buffer. Next, a 2 wt% solution of PEG2000-NH2 (1 mL in Tris buffer) was added to three volumes of 2 wt% PLGA–Fe3O4 composites in Tris buffer and agitated with a vortex mixer for 5 hours at room temperature, followed by sonication for 2 min (50% duty cycle every 4 sec), allowing for PEG2000-NH2 to be attached onto the pD surface of the composites. The PEGylated PLGA–Fe3O4 composites (i.e. PINCs) were collected with a handheld magnet, then redispersed in DI water and stored at 4 °C.
The hydrodynamic diameter and zeta potential of PINCs were measured by dynamic light scattering (DLS) using a Malvern Zetasizer Nano ZS90, and by nanoparticle tracking analysis (NTA) using a NanoSight LM-10 (Malvern, Worcestershire, UK). NP morphologies were characterized by transmission electron microscopy (TEM) using a Tecnai F20 (FEI, Hillsboro, OR) and 2% uranyl acetate for staining, and by scanning electron microscopy (SEM) using a FEI Nova nanoSEM on Pt-sputtered samples. For C*-loaded PINC, fluorescence intensities of C* in NP suspension, pellet, and supernatant were measured with a SpectraMax M3 microplate reader (Molecular Devices, Sunnyvale, CA) at excitation and emission wavelengths of 480 nm and 524 nm, respectively. Fe content was determined by atomic absorption spectroscopy (AAS) using a Perkin-Elmer 3110 Spectrometer (Waltham, MA).
T2 relaxation times of aqueous PINC suspensions were determined using a spin-echo sequence on a BioSpec 7-T small-animal MRI scanner (Bruker, Billerica, MA). Multiecho T2-weighted images were acquired using the following parameters: repetition time (TR) = 1000 msec; Flip angle = 90°/180°; echo time (TE) = 15, 30, 45, 60, 75, and 90 msec; bandwidth = 195 Hz/pixel; matrix size = 256 × 256; field of view (FOV) = 50 mm2; number of excitations (NEX) = 1; number of slices = 1; slice thickness = 1.16 mm.
2.3. NP stability in water and 50% serum
PINCs were dispersed in DI water or in 50% (v/v) fetal bovine serum (FBS) diluted with PBS at a concentration of 125 µg/mL, and incubated at 37 °C with gentle shaking. The fluorescence of these suspensions was monitored at regular intervals with a SpectraMax M3 microplate reader, up to 48 hours. PINCs were then collected by a magnet and redispersed in water, and analyzed by DLS and TEM.
2.4. Cytotoxicity studies
The cytotoxicity of PINCs was tested in SKOV3 human ovarian cancer cells (ATCC, Manassas, VA) and NIH/3T3 murine fibroblasts (ATCC) using the MTT assay. Both cell lines were plated in a 96-well plate at a density of 10,000 cells per well in 200 µL of complete medium, grown overnight, and treated with NPs in a final concentration ranging from 0.005 to 0.32 mg/mL. After 24 hour incubation, the medium was replaced with 100 µL of fresh medium containing 75 µg of MTT reagent and incubated for 3.5 hours, followed by the addition of stop/solubilization solution. The absorbance of solubilized formazan was read with a SpectraMax M3 microplate reader at a wavelength of 562 nm. The measured sample absorbance was normalized to the absorbance of control cells without NP treatment. To evaluate if the magnet-induced internalization of PINCs caused additional toxicity, a set of cells treated with PINCs was placed on a magnet for 30 min prior to the 24-h incubation and MTT assay.
2.5. Cellular uptake and intracellular localization
SKOV3 cells were cultured in RPMI-1640 supplemented with FBS (10% v/v), penicillin (100 IU/mL), and streptomycin (100 IU/mL). NIH/3T3 cells were grown in Dulbecco’s modified Eagle medium (DMEM) supplemented with calf bovine serum (10% v/v) and antibiotics as described above. Cells were incubated at 37 °C in a humidified 5% CO2 atmosphere. All experiments were performed in complete media containing 10% serum.
SKOV3 cells were seeded in 12-well plates containing 1 mL of medium at a density of 104 cells per well and grown to 90% confluence. A Transwell polycarbonate membrane inserts with 0.4-µm pore size (Corning, Corning, NY) were placed in each well, then filled with 80 µg of PINCs in 0.25 mL of fresh medium. A magnet was placed under each well, and the cells were incubated for up to 30 min with shaking at 200 rpm. The magnet and Transwell insert were removed, and the cells were washed twice with fresh medium to remove free or loosely bound PINCs. Cells were first imaged in media with a Cytation 3 Multi-Mode Reader (BioTek, Winooski, VT), then trypsinized, collected by centrifugation at 930 rcf for 5 min, redispersed in 0.3 mL of PBS at 0 °C, and analyzed with an Accuri C6 flow cytometer (BD Biosciences, San Jose, CA) equipped with an FL-1 detector (λex/λem = 488/525 nm). Alternatively, SKOV3 cells treated and collected in the same way were fixed in 4% formaldehyde, followed by MR imaging using the same conditions as described above except for a fixed echo time of 37.5 msec. Another group of cells were tested in the same way with PINCs directly added to each well (i.e., with no Transwell insert).
Intracellular localization of PINCs was evaluated using a Nikon A1R confocal microscope equipped with a Spectra Physics 163C argon ion laser and a Coherent CUBE diode laser. SKOV3 cells were seeded in a 35 mm glass-bottomed Petri dish (MatTek) and grown to 90% confluence, incubated with a Transwell containing 80 µg PINCs, laid over the cell layer, in the presence of a magnet as described above. After 30 min, cells were washed twice with PBS and stained with CellMask Deep Red and Hoechst 33342 to label the membrane and the nuclei, respectively. PINCs were excited at 488 nm (λem = 500–550 nm); nuclear and membrane dyes were excited at 407 nm (λem = 425–475 nm) and 639 nm (λem = 663–738 nm), respectively. Cells were imaged again after additional 3 hour incubation in NP-free medium to determine relative changes in the positions of PINCs and/or released C*. LysoTracker was used to characterize their intracellular trafficking. SKOV3 cells at 90% confluence were incubated for 30 min with 30 nM LysoTracker, washed with PBS and supplied with fresh medium, then treated with 80 µg PINCs as described above. Cells were washed twice with PBS, stained for 5 min with Hoechst 33342, then washed and imaged by confocal microscopy. The cells were incubated in NP-free medium for 6 hours, treated with additional LysoTracker solution and incubated for another hour (total NP-free incubation time was 7 hours), then re-examined by confocal microscopy with excitation at 561 nm (λem = 570–620 nm).
2.6. Magnetophoretic deposition under flow condition
Aqueous suspensions of PINCs were passed through glass capillary tubes (i.d. 0.7 or 1.6 mm) mounted in a polydimethylsiloxane mold against a stack of NdFeB magnets (G = 3 kG/cm). Flow rates were controlled by a syringe pump (single-pass) or a peristaltic pump (continuous, closed-loop flow); capillaries were connected using silicone tubing of appropriate size, followed by an outer sleeve of Tygon® tubing. Samples were prepared by washing and collecting freshly prepared PINCs by magnetic precipitation, then redispersing them in DI water to a final concentration (w/v) of 0.3 mg/mL. The efficiency of magnetophoretic deposition was determined by measuring the Fe content of either the supernatant or retentate using AAS.
2.7. In vivo magnetophoretic delivery
All animal procedures were approved by Purdue Animal Care and Use Committee, in conformity with the NIH guidelines for the care and use of laboratory animals. 5–6 week old female athymic nude mice (Foxn1nu) were purchased from Harlan Laboratories and acclimatized for 1 week prior to the procedure. Each mouse received a subcutaneous injection of 3 × 10⁶ SKOV3 cells in both flanks. When the average tumor volume reached 300–400 mm3, animals were injected with PINCs equivalent to 10 mg Fe/kg via tail vein. Immediately after injection, a handheld magnet (G = 1 kG/cm) was placed on one of the tumors for 30 min. MR images were acquired under 3% isoflurane anesthesia before and after PINC administration and magnet treatment. The time interval between two imaging events was approximately 1 hour. Axial views of whole-body MR images were obtained using a 7-T small-animal MRI scanner. T2*-weighted MR images were obtained using a gradient echo sequence (TR/TE = 1781/15 msec, FOV = 32 mm2, flip angle = 90°/180°, matrix size = 256 × 256, NEX = 4, number of slices = 40, and section thickness = 1 mm). T2*-weighted datasets were processed with ImageJ 1.47v (Bethesda, MD). The signal intensity (SI) of tumor was normalized to SI of muscle at each time point. Signal enhancement was defined as [Normalized SI of tumor (pre-injection) – Normalized SI of tumor (post-injection)]/ Normalized SI of tumor (pre-injection) × 100%.
Following MR imaging, mice were sacrificed and tumors plus major organs were removed and imaged on the IVIS Lumina II system (Caliper life sciences, Hopkinton, MA) to detect C* fluorescence. To quantify C* level in each organ, tumor and organs were homogenized with a Tissue Master homogenizer (Omni International, Kennesaw, GA) in 2 mL of acetonitrile and incubated at room temperature overnight. The organ homogenates were centrifuged at 9,300 rcf for 10 min to separate supernatants, which were analyzed with a SpectraMax M3 microplate reader. To check Fe distribution, tumor sections were stained with Prussian blue. Tumor section slides were immersed in a mixture of 20% HCl and 10% K4Fe(CN)6 for 20 min. The stained slides were washed with water and counterstained with safranin O for 5–10 sec. The slide was dehydrated by sequential washes in 95% ethanol, 100% ethanol, and xylenes.
3. RESULTS AND DISCUSSION
3.1. Synthesis and characterization of PLGA–iron oxide composite nanoparticles
The synthesis of PINCs is illustrated in Scheme 1. Colloidal Fe3O4 was prepared by co-precipitation [28], and suspensions of PLGA NPs were prepared using our previously reported method [27]. The latter was loaded with NBD-conjugated cholesterol (C*), a fluorescent compound representative of poorly water-soluble drugs. The Fe3O4 and PLGA NPs were treated separately with dopamine at pH 8.5 to produce initial pD coatings, then combined in fresh dopamine solution to affix Fe3O4 onto PLGA NP surfaces. The PLGA–Fe3O4 composites could be collected by a handheld NdFeB magnet in less than 1 min, whereas PLGA NPs mixed with colloidal Fe3O4 without dopamine did not respond to magnetic fields at all (Figure S1, Supporting Information), which confirmed the essential role of pD as a cement. The PLGA–Fe3O4 composites tend to aggregate and precipitate in DI water; therefore, the PLGA–Fe3O4 composites were treated with mPEG-NH2 (2 kDa) to stabilize their dispersion in aqueous solutions. We refer to PEGylated PLGA–Fe3O4 composites as PINCs (polymer–iron-oxide nanocomposites).
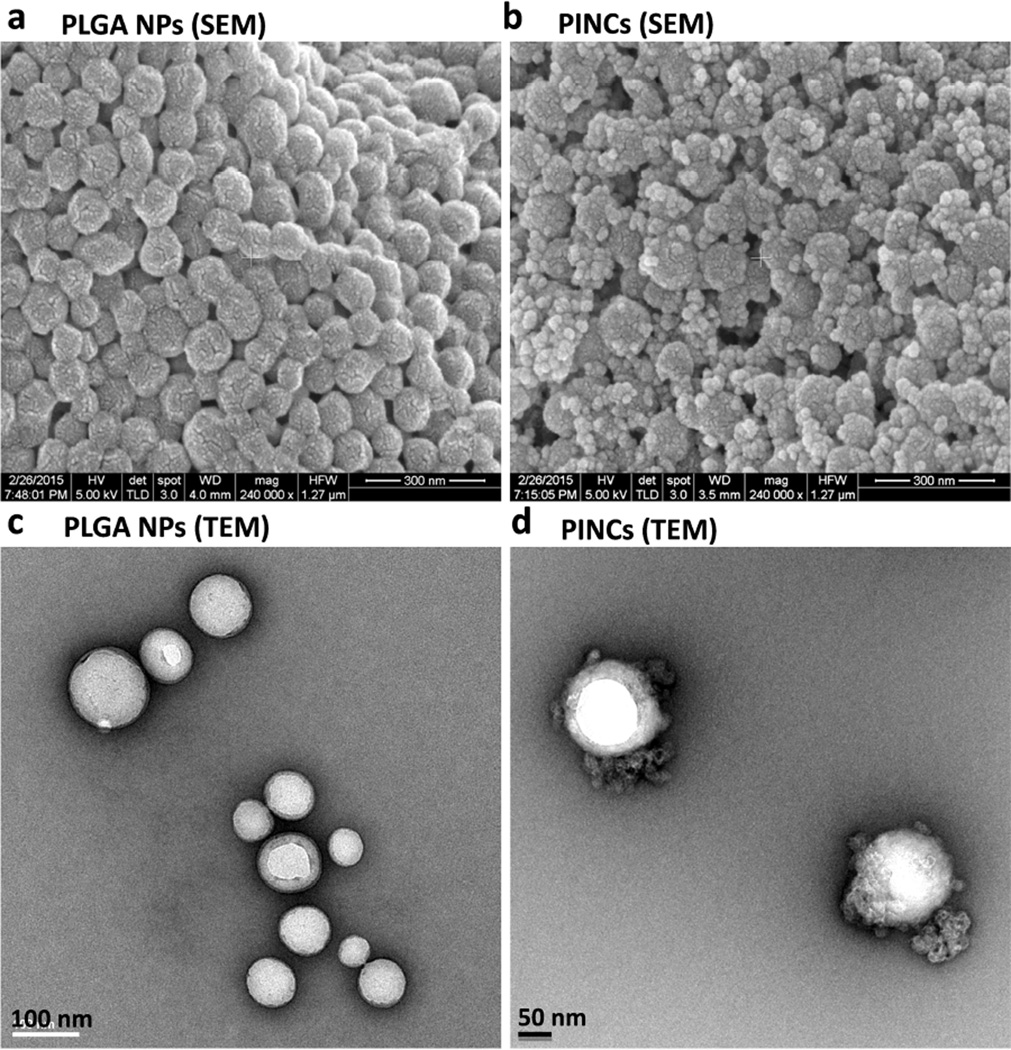
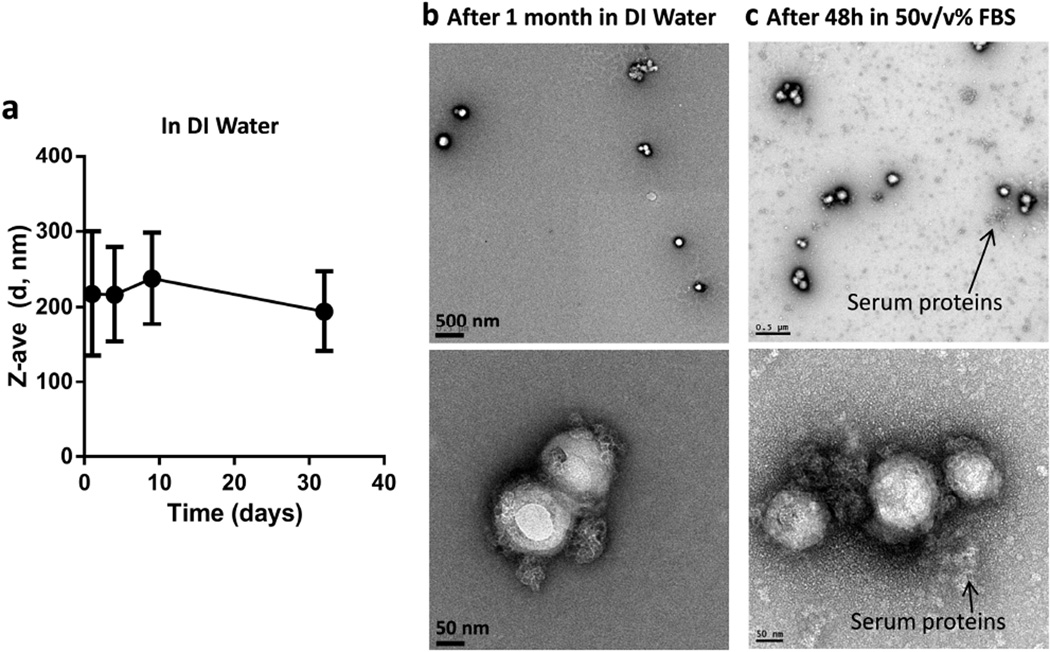
The presence of Fe3O4 particles on the PINC surface was confirmed by scanning and transmission electron microscopy (Figure 1). The Fe content in PINCs was 5–10 wt% according to AAS. The inclusion of Fe enabled their use as contrast agents for magnetic resonance (MR) imaging. T2-weighted images of PINCs in aqueous suspensions showed increasingly hypointense signals in a dose-dependent manner (Figure S2, Supporting Information). The mean hydrodynamic size (dh) of PINCs was 165 nm (15% larger than the initial PLGA NPs) by DLS and 172 nm by NTA (Table 1 and Figure S3, Supporting Information). The dh of PINCs in DI water was constant over one month (Figure 2a), retaining Fe3O4 particles on the surface (Figure 2b). Importantly, PINCs maintained the particle size after 12 hour incubation in 50% (v/v) FBS (Figure S3, Supporting Information), showed minimal change in the shape (Figure 2c), and remained responsive to the magnetic field after 48 hours in 50% FBS, indicating that the carrier’s physical properties were unaffected by serum protein adsorption during the time frame relevant to NP distribution in tumors. This implies that the PINCs should circulate in blood with minimal aggregation, while maintaining their potential for magnetophoretic delivery.
Figure 1.
SEM images of (a) PLGA NPs and (b) PINCs (Scale bars: 300 nm); TEM images of (c) PLGA NPs (Scale bar: 100 nm) and (d) PINCs (Scale bar: 50 nm).
Table 1.
Hydrodynamic size and zeta potential analysis
| Sample Name | Zeta potential (mV) |
DLS mode (Z-average) dh (nm) |
DLS mean (number mean) dh (nm) |
PDI1 | NTA mean dh (nm) |
|---|---|---|---|---|---|
| PLGA NPs | ‒18 | 184 | 155 | 0.031 | --- |
| PINCs | ‒12 | 218 | 165 | 0.145 | 172 ± 52 |
Polydispersity index (PDI) was obtained by cumulant analysis as described in the International Standard on DLS ISO13321 Part 8 (Malvern DLS technical note MRK656-01). Samples with PDI < 0.08 are considered monodisperse.
Figure 2.
(a) Changes in hydrodynamic diameter of PINCs over 1 month in DI water; (b) TEM images of PINCs after 1 month in DI water; (c) TEM images of PINCs after 48 hours in 50% (v/v) FBS. Top: low magnification: Scale bars: 500 nm; Bottom: high magnification: Scale bars: 50 nm.
3.2. Evaluation of carrier properties
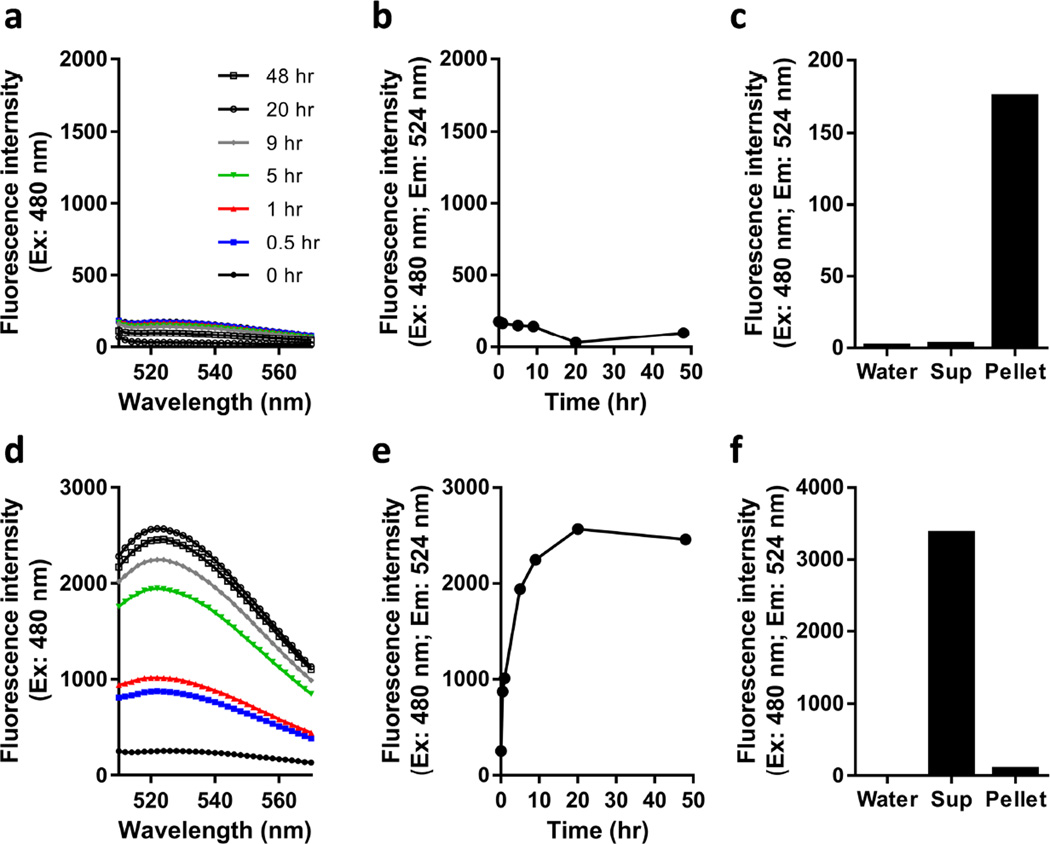
To facilitate characterization of PINCs as drug carriers, PLGA NPs were loaded with C* prior to treatment with pD, Fe3O4, and mPEG-NH2. C*-loaded PINCs could be easily monitored by tracking their fluorescence signals (λex/λem = 480/524 nm). We note that the fluorescence of the encapsulated C* was quenched due to the presence of nearby pD or Fe3O4, however the fluorescence intensities of PINCs were stable with most of the payload remaining with the NPs for 15 days as dispersed in DI water (Figure 3a–c).
Figure 3.
(a,b) Time-dependent changes in NBD fluorescence intensity of PINCs in DI water over a 48-hour period at 37 °C. (c) Fluorescence intensity of supernatant (sup) vs. redispersed pellet collected by centrifugation after 15-day incubation in water at 4 °C. (d,e) Time-dependent changes in C* fluorescence of PINCs in 50% (v/v) FBS solution over a 48-hour period at 37 °C. (f) Fluorescence intensity of supernatant (sup) vs. redispersed pellet collected by centrifugation after 48-hour incubation in 50% (v/v) FBS solution at 37 °C.
Incubating PINCs in serum solution provided critical insights into their capacity as drug carriers under physiological conditions. While PINCs formed stable dispersions in 50% (v/v) FBS, the fluorescence intensity of this suspension increased (i.e., dequenched) over time. Furthermore, the analysis of centrifuged samples after 48 hours revealed most of the fluorescence to be associated with the supernatant (Figure 3d–f). This implied that C* was gradually released from PINCs by transfer to endogenous serum proteins such as albumin. The dequenching process followed first-order kinetics with a rate constant and half-life of 0.25 h−1 and 2.8 hours, respectively. We suspect this leaching phenomenon to be a common problem for most polymer-based drug carriers: previous reports of polymeric micelles [29, 30] and PLGA NPs [22, 23] have also suggested payload attrition in serum solution or during blood circulation due to nonspecific exchange with proteins. Under such circumstances, it is essential to expedite the transport of NPs to tumors to minimize premature drug loss.
The rapid response of PINCs to magnetic field gradients suggests that payload attrition can be mitigated by magnetophoretic acceleration of NP delivery. This was tested under static or steady-state flow conditions by setting up localized field gradients near target locations (inside of cell culture wells or capillaries) with strengths up to 3 kG/cm and a working range of several millimeters (Figure S4, Supporting Information). In the next section, we validated the potential of magnetophoretic delivery of PINCs by designing in vitro experiments that simulated conditions relevant to NP extravasation and retention.
3.3. Magnetophoretic cell uptake
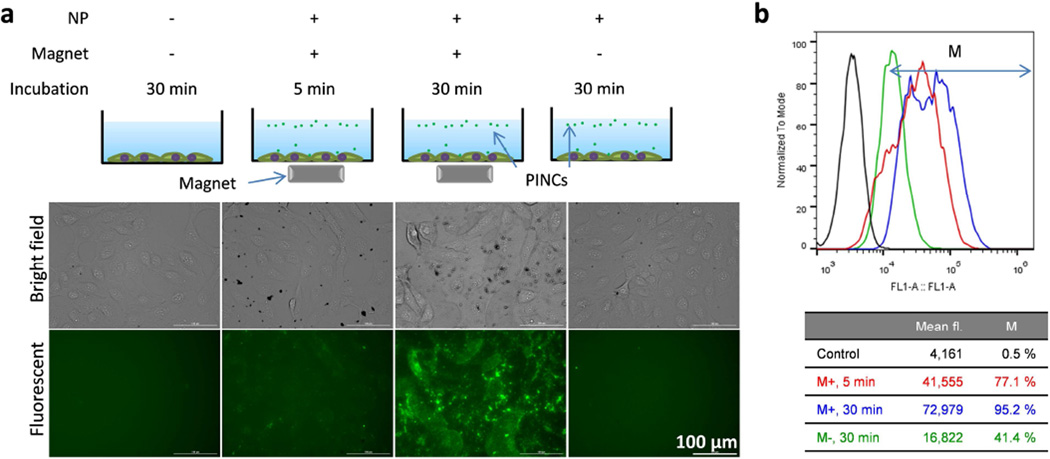
Initial studies were performed with SKOV3 human ovarian cancer cells. First, cell viability assays were performed with multiple cell lines to confirm that PINCs were not more cytotoxic than PLGA NPs at the concentrations used in magnetophoretic delivery (Figure S5, Supporting Information) and that a 30-min exposure to the magnetic field gradient (1 kG/cm) had no detrimental effect on cell viability (Figure S6, Supporting Information). Next, PINCs were added to wells containing adherent SKOV3 cells at a concentration (64 µg/mL) that cells maintained >80% viability, followed by exposure to magnetic field gradients. As expected, PINCs remained fully suspended in the absence of an applied field but were precipitated within minutes in the presence of a magnet (Figure S7, Supporting Information). Cells treated with PINCs were carefully washed and examined by fluorescence microscopy, which revealed dramatic increases in fluorescence intensity associated with cells due to the exposure to field gradients (Figure 4a). Flow cytometry of trypsinized cells further confirmed that cellular uptake of PINCs was minimal in the absence of a magnetic field but greatly enhanced by magnetophoretic delivery, with large signal increases in as little as 5 min (Figure 4b).
Figure 4.
(a) Fluorescence microscopy and (b) flow cytometry of SKOV3 cells incubated with PINCs, with and without exposure to a magnetic field gradient (up to 30 min prior to washing).
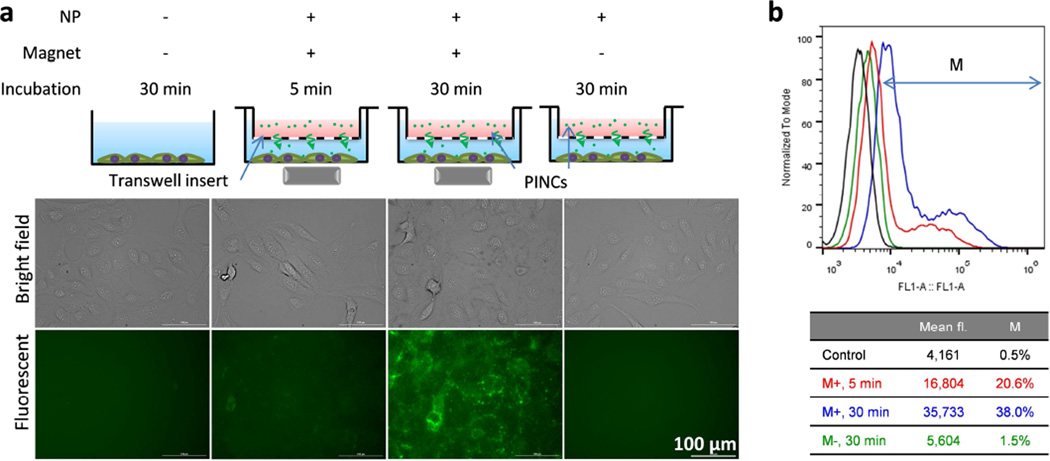
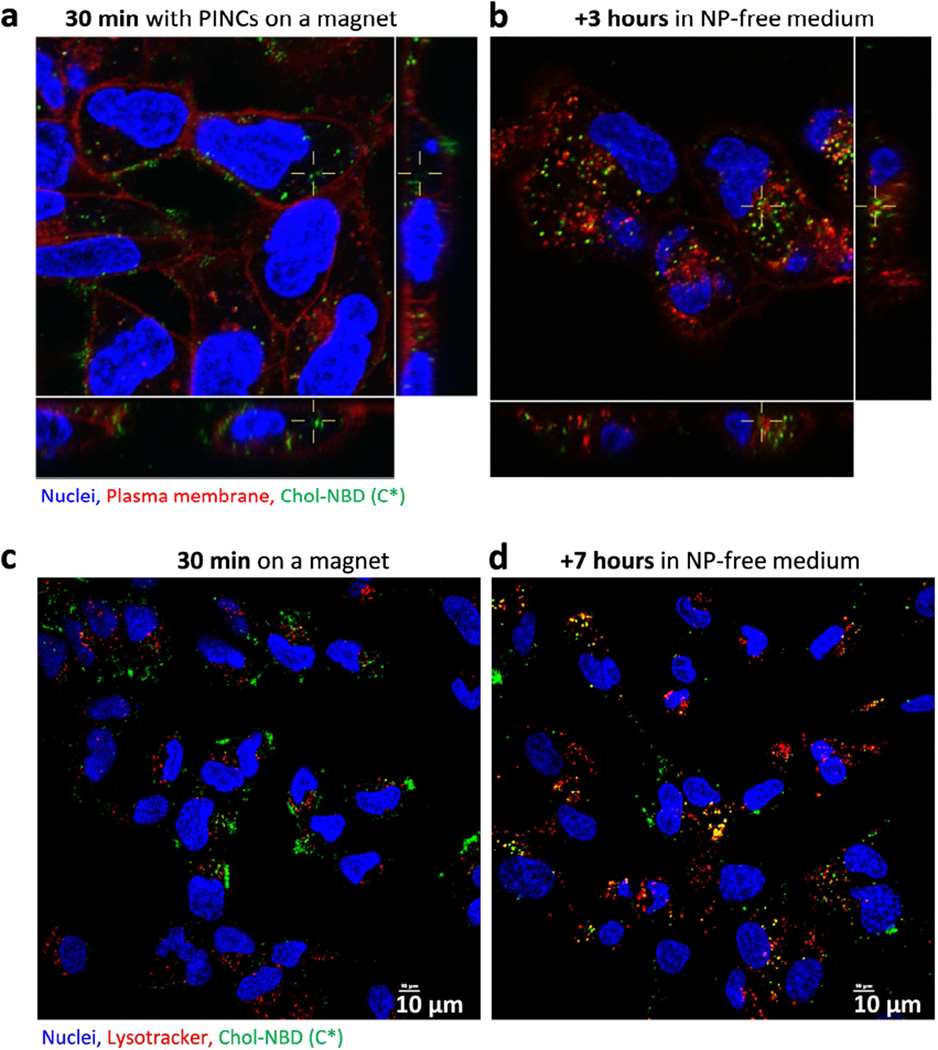
To determine whether magnetophoresis could accelerate the transport of PINCs across physical barriers like the endothelium, PINCs were loaded into Transwell inserts with porous membranes (0.4-µm pore size) suspended 3 mm above a monolayer of SKOV3 cells (Figure S8, Supporting Information), then incubated in the presence of a magnetic field gradient for up to 30 min prior to analysis. In this study, Transwell inserts were used to mimic the leaky endothelial basement membranes of the tumor microvasculature [31]. Again, magnetic field gradients had a clear influence on PINC uptake: fluorescence in the cells was weak after 30 min exposure to PINCs in the absence of a field gradient but much stronger if performed under magnetophoretic conditions, commensurate with a high level of PINC transport across the porous membrane (Figures 5 and S8, Supporting Information). MR tracking and elemental analysis by AAS produced complementary results: after 30 min of exposure to a magnetic field gradient, cells showed a darker T2-weighted MR image with less Fe remaining in the Transwell insert as compared to those with no exposure (Figure S9, Supporting Information). A closer inspection of treated cells by confocal microscopy with plasma membrane stain indicated that PINCs were present on both the cell surface and in the cytoplasm within the first 30 min of magnetophoresis, and PINCs and/or released C* continued to advance into the cells after removal of the magnet (Figure 6a, b). Colocalization with LysoTracker indicated endocytic uptake of PINCs, followed by intracellular trafficking and accumulation in lysosomes as PINCs and/or released C* over the next few hours (Figure 6c, d).
Figure 5.
(a) Fluorescence microscopy and (b) flow cytometry of SKOV3 cells incubated with PINCs placed in a Transwell insert, with and without exposure to a magnetic field gradient (up to 30 min prior to washing).
Figure 6.
Confocal microscopy of (a) SKOV3 cells incubated for 30 min with PINCs placed in a Transwell insert, with exposure to a magnetic field gradient; (b) cells 3-hour post-incubation. (c–d) Intracellular trafficking of PINCs in SKOV3 cells, immediately after 30-min incubation over a magnet (c) and 7-hour post-incubation (d).
It is worth noting that the magnetic field gradient at maximum strength covers a relatively small space (25% of well area); despite this, 38% of all cells exhibited PINC uptake after a 30-min exposure. In the absence of an applied field, only 1.5% of cells exhibited increased fluorescence over the same period (Figure 5b). The lack of fluorescence in cells without exposure to external magnetic fields indicates that nonspecific uptake of leached C*, if any, was minimal over the 30 min period. Therefore, the difference in fluorescence intensity is mainly attributable to the rate of PINC transport across the Transwell membrane, as supported by the simultaneous increase in MR signals in cells exposed to magnetic field gradients.
3.4. Magnetophoretic deposition under flow conditions
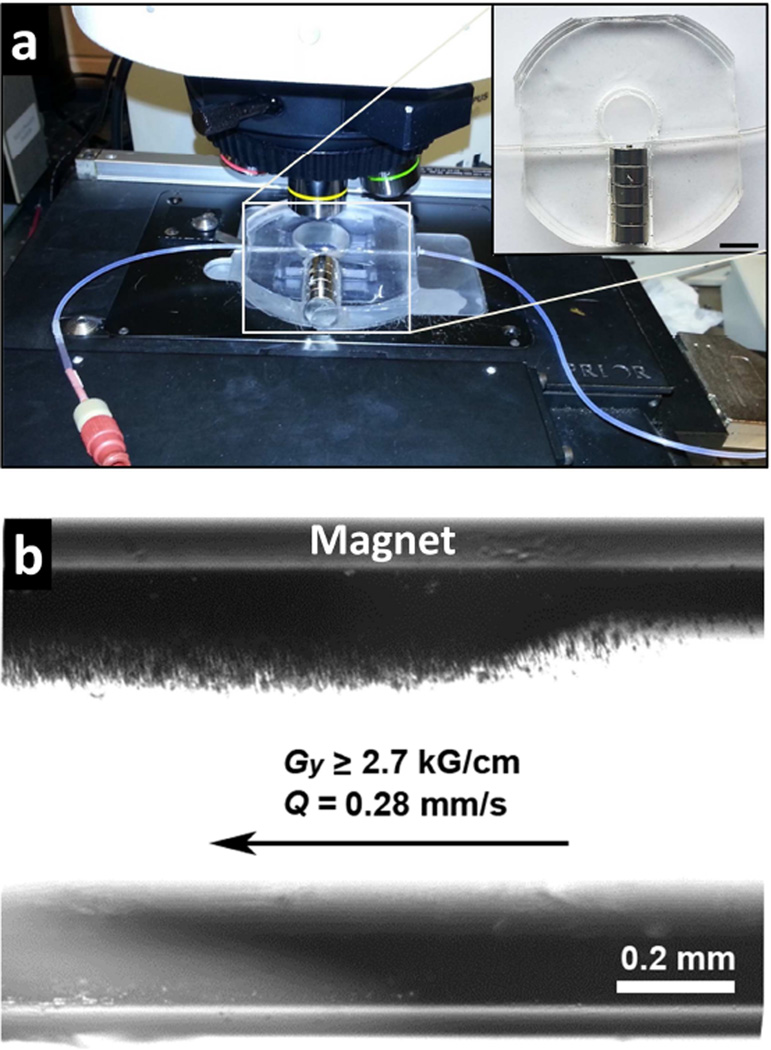
Magnetophoretic deposition of PINCs was performed in glass capillaries under steady-state flow conditions, to address the applicability of magnetic forces in the accumulation and retention of nanomedicines in circulation (Figure 7). Capillary flow creates shear forces in normal or tumor-associated vascular networks, which can influence the efficiency of NP extravasation in different ways. On one hand, extravasation increases with the difference in hydrostatic pressure across the blood vessel (i.e. Starling forces), which depends on flow rate [2]; on the other, increases in shear stress may be counterproductive to extravasation, as it reduces particle adhesion to the capillary membrane [32]. In the latter case, magnetophoresis can improve local extravasation by trapping field-responsive NPs along the capillary wall prior to filtration.
Figure 7.
Magnetophoresis of PINCs under steady-state flow conditions. (a, with inset) Capillary flow passing through magnetic field gradient (Gy = 2.7–3.2 kG/cm; bar = 1 cm). (b) Magnetophoretic deposition of PINCs along capillary wall during flow (Q = 0.28 mm/s).
PINCs were passed through capillary tubes with flow normal to the field gradient (Figure 7). Magnetophoresis experiments were performed with a field gradient of 3 kG/cm using two types of flow conditions: retention of PINCs within capillaries after a single pass at low flux (0.3–3.6 mm/s), and retention under continuous flow in a closed loop at higher flux (42.6 mm/s), as a function of the number of cycles using a fixed volume. Extravasation typically occurs in postcapillary venules with velocities on the order of 0.3 mm/s; the shear flow increases as the blood enters venous circulation [33]. Therefore, these conditions cover a range of flow rates encountered under physiological conditions.
PINC retention was quantified by measuring the Fe content of the supernatant or retentate by AAS. As expected, capture efficiency was highest at low flow: PINCs at an initial concentration of 0.3 mg/mL could be collected quantitatively in a single pass at a constant flux of 0.28 mm/s, to a final concentration of 150 mg/mL, corresponding to a 500-fold increase (Table 2). Magnetophoresis was also effective at higher flow rates; PINC capture efficiencies of 28% could still be achieved in a single pass, even with an order of magnitude increase in flux.
Table 2.
Magnetophoresis of PINCs under steady-state flow conditions
| Entry | Flow experiment | Flux (Q), mm/s |
Flow rate, mm3/s (mL/h) |
Vtotal, mL |
Time, H |
% NP capturea |
fold increasea |
|---|---|---|---|---|---|---|---|
| 1 | 1.6 mm capillary, single pass |
0.28 | 0.56 (2.0) | 10 | 5.0 | >99 | 500 |
| 2 | 0.7 mm capillary, single pass |
0.72 | 0.28 (1.0) | 1 | 1.0 | 56 | 145 |
| 3 | 0.7 mm capillary, single pass |
3.6 | 1.38 (5.0) | 1 | 0.2 | 28 | 73 |
| 4 b | 1.6 mm capillary, closed loop |
42.6 | 85.7 (308) | 6 (128 cycles) |
2.5 | 85 | 254 |
| 5 | 1.6 mm capillary, closed loop |
“ | “ | 6 (51 cycles) |
1.0 | 59 | 176 |
| 6 | 1.6 mm capillary, closed loop |
“ | “ | 6 (26 cycles) |
0.5 | 46 | 137 |
Based on Fe content of supernatant or retentate, as measured by AAS.
Performed twice; mean values presented (error <2%).
To evaluate the efficiency of magnetophoretic deposition under circulatory conditions, we conducted capture experiments in a closed-loop system with peristaltic flow, using the lowest velocity available. Remarkably, magnetophoretic capture continued to be efficient: despite a 150-fold increase in flux, collection of PINCs increased with the number of cycles at an estimated first-order decay rate of 0.8 h−1 (85% capture over a 2.5 hour period), with more than a 250-fold increase in PINC concentration within the magnetic field gradient. These results suggest that magnetophoretic deposition can increase the local density of PINCs by up to 3 orders of magnitude, with upper limits defined by the concentration of circulating particles and the strength of magnetic field gradients in the region of interest.
3.5. In vivo magnetophoretic delivery
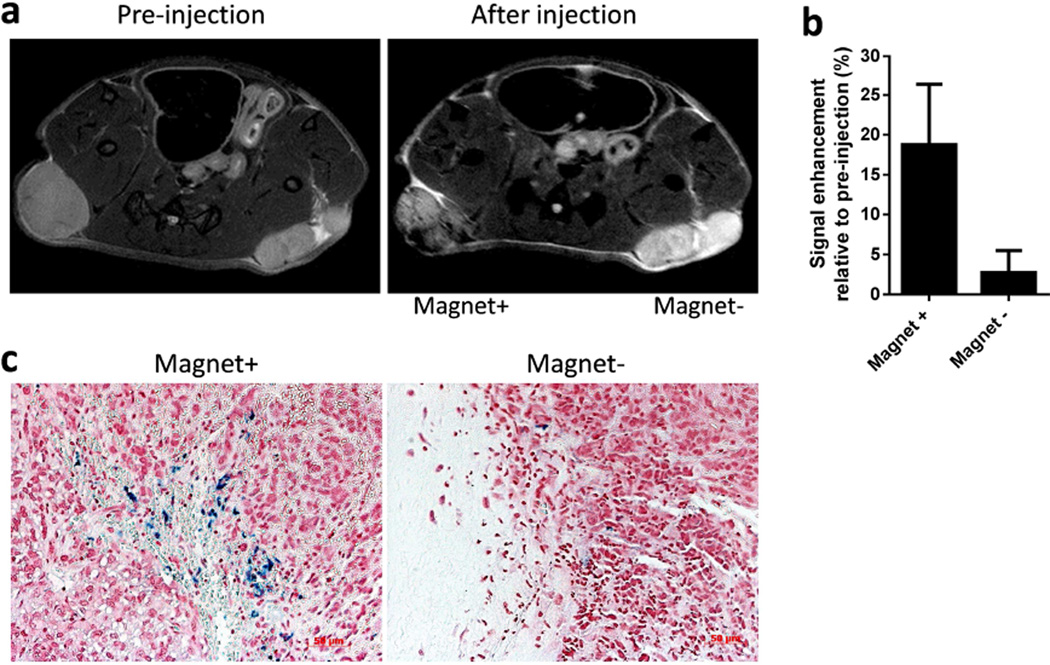
To determine whether magnetically guided PINC delivery to tumors might be a useful alternative to accumulation by passive extravasation (i.e. EPR effect), PINCs equivalent to 10 mg Fe/kg were administered in vivo by tail vein injection into nude mice bearing subcutaneous SKOV3 tumor xenografts on each flank. This model was chosen for its limited EPR potential: subcutaneous SKOV3 xenografts are known for their low degree of vascularization and poor extravasation of NPs larger than 5 nm [11, 34, 35]. We confirmed the slow growth of SKOV3 xenografts and the low level of tumor vascularization by whitish appearance and poor accumulation of Evans blue dye relative to MCF7 and LS174T xenografts (Figure S10, Supporting Information). As expected, tumors that were not exposed to magnets produced little differences in T2-weighted MRI signal intensity before and 1 hour after PINC administration, indicating the lack of a significant EPR effect. In contrast, the tumor in the same mouse exposed to an external magnet field gradient (1 kG/cm) during NP circulation appeared darker relative to pre-administration (Figure 8, S11, Supporting information). To quantify these changes, the signal intensity (SI) of tumors was normalized to SI of muscle and compared with SI values acquired pre-administration. Magnetophoretic delivery of PINCs during circulation enhanced the SI of tumors by 20% compared to pre-injection measurements, whereas the SI of tumors without magnetic field exposure increased by only 3%.
Figure 8.
(a) Representative T2-weighted MR images of tumors before and after treatment with PINCs, and with or without 30-min field exposure. The time interval between two imaging events was approximately 1 hour. (b) Signal enhancement at tumor site after injection of PINCs with and without magnet (n=4). (c) Prussian blue-stained tumor sections after MR study (magnification: 200×).
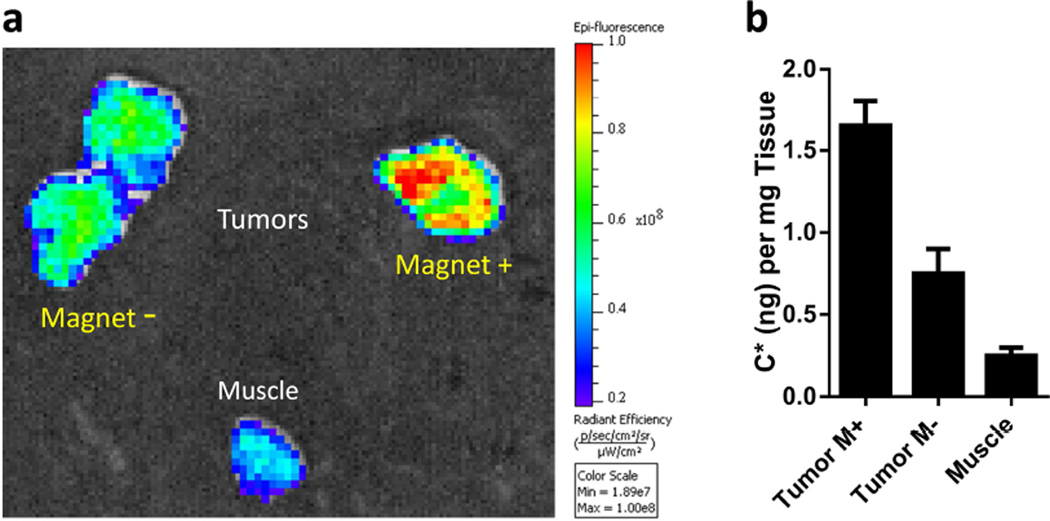
To confirm the accumulation of PINCs within tumors, excised tissues were stained with Prussian blue and examined to assess the relative density of intratumoral Fe. Numerous dark blue regions could be observed in the field-exposed tumors, consistent with the MR images, whereas the contralateral tumors with no magnet exposure had virtually no blue signals (Figure 8c). We note that, while PINC localization in tumors was clearly increased by magnetophoretic delivery, organs associated with the reticuloendothelial system (RES) such as the liver and spleen remained the primary destination of PINCs post-administration (Figure S12, Supporting Information). Little accumulation was observed in the kidneys, indicating that PINCs were physically stable during circulation for at least 1 hour. We also performed an independent analysis of C* levels in tumors and major organs via ex vivo fluorescence imaging. Consistent with the MR data, tumors exposed to magnets produced stronger fluorescence than the negative controls (Figure 9a and S13, Supporting Information); as expected, the liver also had strong fluorescence (Figure S14, Supporting Information). C* was also extracted from tissue homogenates for quantitative distribution in each organ; again, the delivery of PINCs to tumors exposed to magnets was higher than the controls (Figure 9b).
Figure 9.
(a) Representative ex vivo fluorescence images of tumors and muscle tissue after tail-vein injection of PINCs, with or without 30-min field exposure. Tissue samples were obtained 1 hour after injection. (b) C* levels in tumors and muscle, obtained by extraction (n=2).
This study shows that magnetically-guided PINC delivery to tumors can enhance accumulation of drug in poorly vascularized tumors, where the EPR effect offers little benefit in NP delivery to tumors. However, a few questions remain with respect to the design of PINCs. First of all, the current form of PINCs does not distinguish cancer cells and normal cells; thus, it is possible that the extravasated PINCs will affect both cancer cells and non-cancerous cells in tumors. Depending on the effect of delivered drugs, it may be necessary to minimize the PINC uptake by off-target cells such as stromal cells or tissue-associated macrophages in tumors. Secondly, it remains to be seen whether the magnetophoretically delivered PINCs will stay in tumors after the removal of magnetic field. It is possible that PINCs may be pushed back to the circulation in the absence of magnetic field that has attracted PINCs to the tumors. Both questions may be addressed by introducing additional features such as cancer cell-interactive ligands, which can be done during the surface modification of the PLGA–Fe3O4 composites.
With further advances in imaging technologies, magnetophoretic localization of NP drug carriers in target tissues will be clinically feasible. The accumulation of PINCs in tumors in this study is relatively modest, due in part to the limited strength and directional control of the applied field gradient. This belies the full potential of magnetically guided drug delivery, which was characterized quantitatively in our in vitro studies under steady-state flow conditions (Figure 7 and Table 2). For clinical translation of magnetophoretic delivery and evaluation, one needs to design magnetic arrays that can generate sufficiently strong field gradients within tissues of interest, as well as subsurface imaging modalities with millimeter resolution. Recent progress in the design of Halbach arrays indicate the possibility of producing sizable field gradients in tissue at depths of 10 cm, at much greater strengths than that produced by dipolar magnets of comparable size [36, 37]. With regard to locating tumors, high-resolution imaging of vascularized tissues is already addressable by MR as well as by ultrasound [38], photoacoustic tomography [39], and optical coherence tomography [40].
4. CONCLUSIONS
This study shows that magnetophoretic delivery can be used to overcome two pressing challenges in NP-based drug delivery to tumors: the heterogeneity of the EPR effect and the payload attrition from drug carriers during circulation. We show that a simple and versatile surface modification method based on dopamine polymerization can convert drug-loaded polymeric NPs into polymer–iron-oxide nanocomposites (PINCs) compatible with the magnetophoetic delivery. Under magnetic field gradients, PINCs in flow conditions can be captured to increase the local concentration by 500-fold and also quickly transported across physical barriers for accumulation inside target cells. Magnetophoretic delivery is applicable in vivo, as demonstrated by the enhanced accumulation of PINCs in subcutaneous SKOV3 xenografts with limited EPR potential. Further developments in the design of high-strength magnetic field gradients should enable PINCs to surmount the challenges in tumor drug delivery with greater precision and efficiency.
Supplementary Material
Acknowledgments
This work was supported by a Lilly Innovation Fellowship Award, NIH R01 EB017791, and the Purdue University Center for Cancer Research (NIH P30 CA023168). We thank Gregory Tamer for technical support with MR imaging and data analysis, and Paul Bower for assistance with atomic absorption spectroscopy.
Footnotes
Publisher's Disclaimer: This is a PDF file of an unedited manuscript that has been accepted for publication. As a service to our customers we are providing this early version of the manuscript. The manuscript will undergo copyediting, typesetting, and review of the resulting proof before it is published in its final citable form. Please note that during the production process errors may be discovered which could affect the content, and all legal disclaimers that apply to the journal pertain.
REFERENCES
- 1.Matsumura Y, Maeda H. A new concept for macromolecular therapeutics in cancer chemotherapy: mechanism of tumoritropic accumulation of proteins and the antitumor agent smancs. Cancer Res. 1986;46:6387–6392. [PubMed] [Google Scholar]
- 2.Maeda H, Nakamura H, Fang J. The EPR effect for macromolecular drug delivery to solid tumors: Improvement of tumor uptake, lowering of systemic toxicity, and distinct tumor imaging in vivo. Adv. Drug Deliv. Rev. 2013;65:71–79. doi: 10.1016/j.addr.2012.10.002. [DOI] [PubMed] [Google Scholar]
- 3.Davis ME, Chen Z, Shin DM. Nanoparticle therapeutics: an emerging treatment modality for cancer. Nat. Rev. Drug Discov. 2008;7:771–782. doi: 10.1038/nrd2614. [DOI] [PubMed] [Google Scholar]
- 4.Peer D, Karp JM, Hong S, Farokhzad OC, Margalit R, Langer R. Nanocarriers as an emerging platform for cancer therapy. Nat. Nano. 2007;2:751–760. doi: 10.1038/nnano.2007.387. [DOI] [PubMed] [Google Scholar]
- 5.Farokhzad OC, Langer R. Impact of nanotechnology on drug delivery. ACS Nano. 2009;3:16–20. doi: 10.1021/nn900002m. [DOI] [PubMed] [Google Scholar]
- 6.Maeda H. Toward a full understanding of the EPR effect in primary and metastatic tumors as well as issues related to its heterogeneity. Adv. Drug Deliv. Rev. 2015;91:3–6. doi: 10.1016/j.addr.2015.01.002. [DOI] [PubMed] [Google Scholar]
- 7.Kunjachan S, Pola R, Gremse F, Theek B, Ehling J, Moeckel D, et al. Passive versus active tumor targeting using RGD- and NGR-modified polymeric nanomedicines. Nano Lett. 2014;14:972–981. doi: 10.1021/nl404391r. [DOI] [PMC free article] [PubMed] [Google Scholar]
- 8.Nichols JW, Bae YH. EPR: Evidence and fallacy. J. Control. Release. 2014;190:451–464. doi: 10.1016/j.jconrel.2014.03.057. [DOI] [PubMed] [Google Scholar]
- 9.Bertrand N N, Wu J, Xu X, Kamaly N, Farokhzad OC. Cancer nanotechnology: The impact of passive and active targeting in the era of modern cancer biology. Adv. Drug Deliv. Rev. 2014;66:2–25. doi: 10.1016/j.addr.2013.11.009. [DOI] [PMC free article] [PubMed] [Google Scholar]
- 10.Prabhakar U, Maeda H, Jain RK, Sevick-Muraca EM, Zamboni W, Farokhzad OC, et al. Challenges and key considerations of the enhanced permeability and retention effect for nanomedicine drug delivery in oncology. Cancer Res. 2013;73:2412–2417. doi: 10.1158/0008-5472.CAN-12-4561. [DOI] [PMC free article] [PubMed] [Google Scholar]
- 11.Smith BR, Kempen P, Bouley D, Xu A, Liu Z, Melosh N, et al. Shape matters: intravital microscopy reveals surprising geometrical dependence for nanoparticles in tumor models of extravasation. Nano Lett. 2012;12:3369–3377. doi: 10.1021/nl204175t. [DOI] [PMC free article] [PubMed] [Google Scholar]
- 12.Shi C, Guo D, Xiao K, Wang X, Wang L, Luo J. A drug-specific nanocarrier design for efficient anticancer therapy. Nat. Commun. 2015;6:7449. doi: 10.1038/ncomms8449. [DOI] [PMC free article] [PubMed] [Google Scholar]
- 13.Lubbe AS, Alexiou C, Bergemann C. Clinical applications of magnetic drug targeting. J. Surg. Res. 2001;95:200–206. doi: 10.1006/jsre.2000.6030. [DOI] [PubMed] [Google Scholar]
- 14.Alexiou C, Jurgons R. Magnetism in Medicine. KGaA: Wiley-VCH Verlag GmbH & Co; 2007. Magnetic Drug Targeting; pp. 596–605. [Google Scholar]
- 15.Shapiro B, Kulkarni S, Nacev A, Muro S, Stepanov PY, Weinberg IN. Open challenges in magnetic drug targeting. Wiley Interdiscip Rev. Nanomed. Nanobiotechnol. 2015;7:446–457. doi: 10.1002/wnan.1311. [DOI] [PMC free article] [PubMed] [Google Scholar]
- 16.Hua MY, Yang HW, Liu HL, Tsai RY, Pang ST, Chuang KL, et al. Superhigh-magnetization nanocarrier as a doxorubicin delivery platform for magnetic targeting therapy. Biomaterials. 2011;32:8999–9010. doi: 10.1016/j.biomaterials.2011.08.014. [DOI] [PubMed] [Google Scholar]
- 17.Alexiou C, Schmid RJ, Jurgons R, Kremer M, Wanner G, Bergemann C C, et al. Targeting cancer cells: magnetic nanoparticles as drug carriers. Eur. Biophys. J. 2006;35:446–450. doi: 10.1007/s00249-006-0042-1. [DOI] [PubMed] [Google Scholar]
- 18.Hua MY, Liu HL, Yang HW, Chen PY, Tsai RY, Huang CY, et al. The effectiveness of a magnetic nanoparticle-based delivery system for BCNU in the treatment of gliomas. Biomaterials. 2011;32:516–527. doi: 10.1016/j.biomaterials.2010.09.065. [DOI] [PubMed] [Google Scholar]
- 19.Nobuto H, Sugita T, Kubo T, Shimose S, Yasunaga Y, Murakami T, et al. Evaluation of systemic chemotherapy with magnetic liposomal doxorubicin and a dipole external electromagnet. Int. J. Cancer. 2004;109:627–635. doi: 10.1002/ijc.20035. [DOI] [PubMed] [Google Scholar]
- 20.Fortin-Ripoche JP, Martina MS, Gazeau F, Menager C, Wilhelm C, Bacri JC, et al. Magnetic targeting of magnetoliposomes to solid tumors with MR imaging monitoring in mice: feasibility. Radiology. 2006;239:415–424. doi: 10.1148/radiol.2392042110. [DOI] [PubMed] [Google Scholar]
- 21.Lubbe AS, Bergemann C, Riess H, Schriever F, Reichardt P, Possinger K, et al. Clinical experiences with magnetic drug targeting: a phase I study with 4'-epidoxorubicin in 14 patients with advanced solid tumors. Cancer Res. 1996;56:4686–4693. [PubMed] [Google Scholar]
- 22.Xu P, Gullotti E, Tong L, Highley CB, Errabelli DR, Hasan T, et al. Intracellular drug delivery by poly(lactic-co-glycolic acid) nanoparticles. revisited. Mol. Pharm. 2009;6:190–201. doi: 10.1021/mp800137z. [DOI] [PMC free article] [PubMed] [Google Scholar]
- 23.Abouelmagd SA, Sun B, Chang AC, Ku YJ, Yeo Y. Release kinetics study of poorly water-soluble drugs from nanoparticles: Are we doing it right? Mol. Pharm. 2015;12:997–1003. doi: 10.1021/mp500817h. [DOI] [PMC free article] [PubMed] [Google Scholar]
- 24.Elbialy NS, Fathy MM, Khalil WM. Doxorubicin loaded magnetic gold nanoparticles for in vivo targeted drug delivery. Int. J. Pharm. 2015;490:190–199. doi: 10.1016/j.ijpharm.2015.05.032. [DOI] [PubMed] [Google Scholar]
- 25.Hafeli UO, Riffle JS, Harris-Shekhawat L, Carmichael-Baranauskas A, Mark F, Dailey JP, et al. Cell uptake and in vitro toxicity of magnetic nanoparticles suitable for drug delivery. Mol. Pharm. 2009;6:1417–1428. doi: 10.1021/mp900083m. [DOI] [PubMed] [Google Scholar]
- 26.Lee H, Dellatore SM, Miller WM, Messersmith PB. Mussel-inspired surface chemistry for multifunctional coatings. Science. 2007;318:426–430. doi: 10.1126/science.1147241. [DOI] [PMC free article] [PubMed] [Google Scholar]
- 27.Park J, Brust TF, Lee HJ, Lee SC, Watts VJ, Yeo Y. Polydopamine-based simple and versatile surface modification of polymeric nano drug carriers. ACS Nano. 2014;8:3347–3356. doi: 10.1021/nn405809c. [DOI] [PMC free article] [PubMed] [Google Scholar]
- 28.Massart R, Cabuil V. Synthesis of colloidal magnetite in alkaline medium: yield and particle size control. Journal de Chimie Physique. 1987;84:967–973. [Google Scholar]
- 29.Chen H, Kim S, Li L, Wang S, Park K, Cheng J-X. Release of hydrophobic molecules from polymer micelles into cell membranes revealed by Forster resonance energy transfer imaging. Proc. Natl. Acad. Sci. U. S. A. 2008;105:6596–6601. doi: 10.1073/pnas.0707046105. [DOI] [PMC free article] [PubMed] [Google Scholar]
- 30.Chen H, Kim S, He W, Wang H, Low PS, Park K, et al. Fast release of lipophilic agents from circulating PEG-PDLLA micelles revealed by in vivo forster resonance energy transfer imaging. Langmuir. 2008;24:5213–5217. doi: 10.1021/la703570m. [DOI] [PubMed] [Google Scholar]
- 31.Hobbs SK, Monsky WL, Yuan F, Roberts WG, Griffith L, Torchilin VP, et al. Regulation of transport pathways in tumor vessels: Role of tumor type and microenvironment. Proc. Natl. Acad. Sci. U. S. A. 1998;95:4607–4612. doi: 10.1073/pnas.95.8.4607. [DOI] [PMC free article] [PubMed] [Google Scholar]
- 32.Miles FL, Pruitt FL, van Golen KL, Cooper CR. Stepping out of the flow: capillary extravasation in cancer metastasis. Clin. Exp. Metastasis. 2008;25:305–324. doi: 10.1007/s10585-007-9098-2. [DOI] [PubMed] [Google Scholar]
- 33.Marieb EN, Hoehn K. Human Anatomy & Physiology. 9th. Pearson Education, Inc.; 2013. The cardiovascular system: blood vessels; p. 712. [Google Scholar]
- 34.Smith BR, Cheng Z, De A, Koh AL, Sinclair R, Gambhir SS. Real-time intravital imaging of RGD-quantum dot binding to luminal endothelium in mouse tumor neovasculature. Nano Lett. 2008;8:2599–2606. doi: 10.1021/nl080141f. [DOI] [PMC free article] [PubMed] [Google Scholar]
- 35.Kong G, Braun RD, Dewhirst MW. Hyperthermia enables tumor-specific nanoparticle delivery: effect of particle size. Cancer Res. 2000;60:4440–4445. [PubMed] [Google Scholar]
- 36.Shapiro B, Kulkarni S, Nacev A, Sarwar A, Preciado D, Depireux DA. Shaping magnetic fields to direct therapy to ears and eyes. Annu. Rev. Biomed. Eng. 2014;16:455–481. doi: 10.1146/annurev-bioeng-071813-105206. [DOI] [PubMed] [Google Scholar]
- 37.Sarwar A, Nemirovski A, Shapiro B. Optimal Halbach permanent magnet designs for maximally pulling and pushing nanoparticles. J. Magn. Magn. Mater. 2012;324:742–754. doi: 10.1016/j.jmmm.2011.09.008. [DOI] [PMC free article] [PubMed] [Google Scholar]
- 38.Phillips EH, Yrineo AA, Schroeder HD, Wilson KW, Cheng JX, Goergen CJ. Morphological and biomechanical differences in the elastase and AngII apoE (−/−) rodent models of abdominal aortic aneurysms. Biomed. Res. Int. 2015;2015:413189. doi: 10.1155/2015/413189. [DOI] [PMC free article] [PubMed] [Google Scholar]
- 39.Xia J, Yao J, Wang LV. Photoacoustic tomography: principles and advances. Electromagnetic waves (Cambridge. Mass) 2014;147:1–22. doi: 10.2528/pier14032303. [DOI] [PMC free article] [PubMed] [Google Scholar]
- 40.Wang T, Brewer M, Zhu Q. An overview of optical coherence tomography for ovarian tissue imaging and characterization. Wiley Interdisciplinary Reviews: Nanomedicine and Nanobiotechnology. 2015;7:1–16. doi: 10.1002/wnan.1306. [DOI] [PMC free article] [PubMed] [Google Scholar]
Associated Data
This section collects any data citations, data availability statements, or supplementary materials included in this article.


