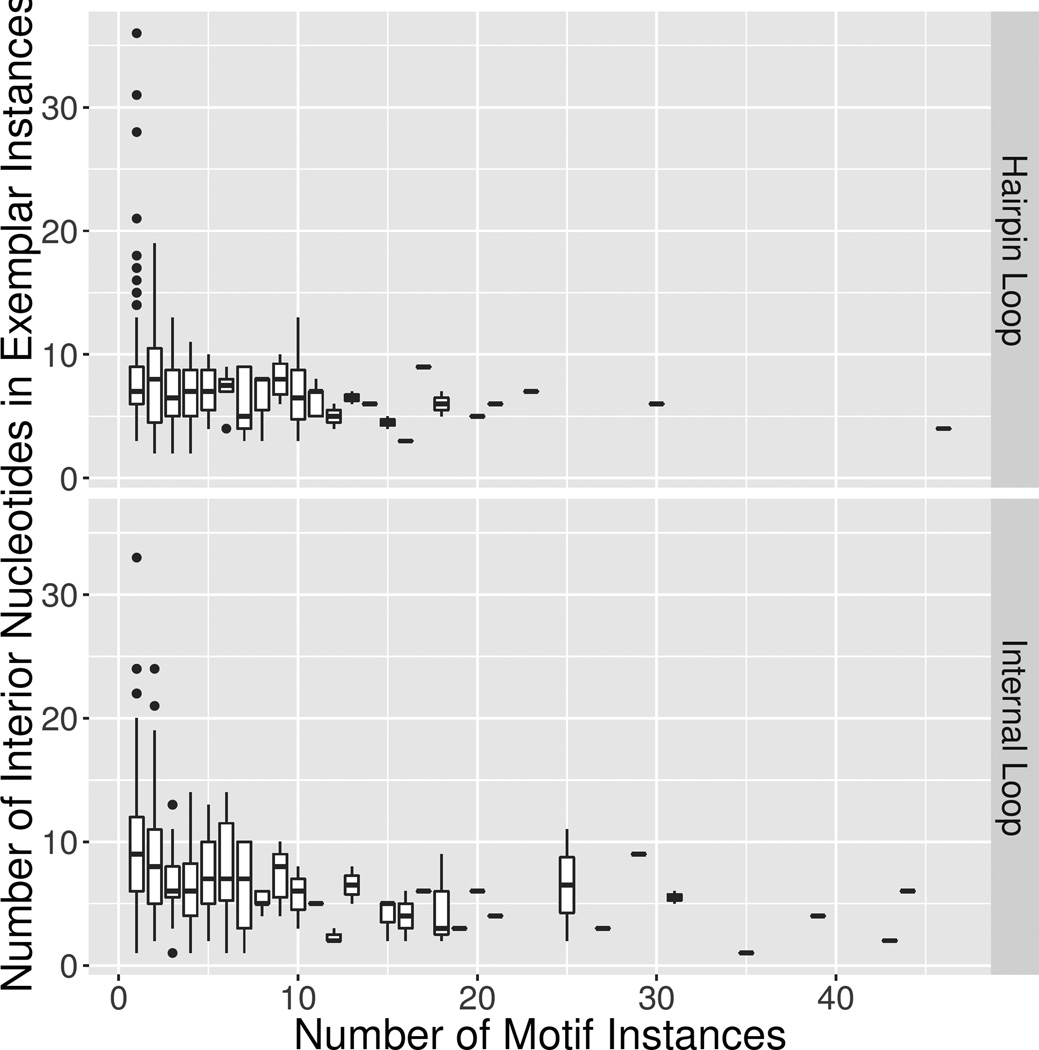
Figure 6.
Box and whisker plot of number of interior nucleotides in exemplar instances versus the number of motif instances in Motif Release 1.18. Top panel is HL groups and bottom panel is IL groups. The box plot represents the range of interior nucleotides for motifs with the given size. Singletons are the leftmost group with size 1. The means are indicated by the bold lean in each box while the bars around each box cover the first and third quartile. Outliers are indicated with dots. A small number of motif groups have more than 50 instances, but all are small in size (< 10 nts) and very homogeneous.

